LensCrafters 2013 Annual Report Download - page 114
Download and view the complete annual report
Please find page 114 of the 2013 LensCrafters annual report below. You can navigate through the pages in the report by either clicking on the pages listed below, or by using the keyword search tool below to find specific information within the annual report.-
 1
1 -
2
-
3
-
4
-
5
-
6
-
7
-
8
-
9
-
10
-
11
-
12
-
13
-
14
-
15
-
16
-
17
-
18
-
19
-
20
-
21
-
22
-
23
-
24
-
25
-
26
-
27
-
28
-
29
-
30
-
31
-
32
-
33
-
34
-
35
-
36
-
37
-
38
-
39
-
40
-
41
-
42
-
43
-
44
-
45
-
46
-
47
-
48
-
49
-
50
-
51
-
52
-
53
-
54
-
55
-
56
-
57
-
58
-
59
-
60
-
61
-
62
-
63
-
64
-
65
-
66
-
67
-
68
-
69
-
70
-
71
-
72
-
73
-
74
-
75
-
76
-
77
-
78
-
79
-
80
-
81
-
82
-
83
-
84
-
85
-
86
-
87
-
88
-
89
-
90
-
91
-
92
-
93
-
94
-
95
-
96
-
97
-
98
-
99
-
100
-
101
-
102
-
103
-
 104
104 -
 105
105 -
 106
106 -
 107
107 -
 108
108 -
 109
109 -
 110
110 -
 111
111 -
 112
112 -
 113
113 -
 114
114 -
 115
115 -
 116
116 -
 117
117 -
 118
118 -
 119
119 -
 120
120 -
 121
121 -
 122
122 -
 123
123 -
 124
124 -
125
-
126
-
127
-
128
-
129
-
130
-
131
-
132
-
133
-
134
-
135
-
136
-
137
-
138
-
139
-
140
-
141
-
142
-
143
-
144
-
145
-
146
-
147
-
148
-
149
-
150
-
151
-
152
-
153
-
154
-
155
-
156
-
157
-
158
-
159
-
160
-
161
-
162
-
163
-
164
-
165
-
166
-
167
-
168
-
169
-
170
-
171
-
172
-
173
-
174
-
175
-
176
-
177
-
178
-
179
-
180
-
181
-
182
-
183
-
184
-
185
-
186
-
187
-
188
-
189
-
190
-
191
-
192
-
193
-
194
-
195
-
196
-
197
-
198
-
199
-
200
-
201
-
202
-
203
-
204
-
205
-
206
-
207
-
208
-
209
-
210
-
211
-
212
-
213
-
214
-
215
-
216
-
217
-
218
-
219
-
220
-
221
-
222
-
223
-
224
-
225
-
226
-
227
-
228
-
229
-
230
-
231
-
232
-
233
-
234
-
235
-
236
-
237
-
238
-
239
-
240
-
241
-
242
-
243
-
244
-
245
-
246
-
247
-
248
-
249
-
250
-
251
-
252
-
253
 |
 |
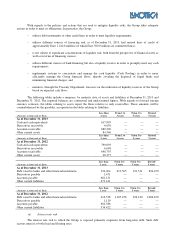
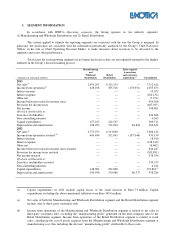
With regards to the policies and actions that are used to mitigate liquidity risks, the Group takes adequate
actions in order to meet its obligations. In particular, the Group:
– utilizes debt instruments or other credit lines in order to meet liquidity requirements;
– utilizes different sources of financing and, as of December 31, 2013, had unused lines of credit of
approximately Euro 1,242.6 million (of which Euro 500.0 million are committed lines);
– is not subject to significant concentrations of liquidity risk, both from the perspective of financial assets as
well as in terms of financing sources;
– utilizes different sources of bank financing but also a liquidity reserve in order to promptly meet any cash
requirements;
– implements systems to concentrate and manage the cash liquidity (Cash Pooling) in order to more
efficiently manage the Group financial flows, thereby avoiding the dispersal of liquid funds and
minimizing financial charges; and
– monitors, through the Treasury Department, forecasts on the utilization of liquidity reserves of the Group
based on expected cash flows.
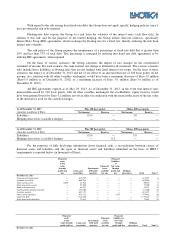
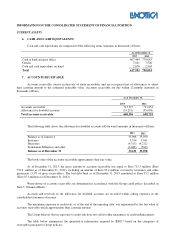
The following tables include a summary, by maturity date, of assets and liabilities at December 31, 2013 and
December 31, 2012. The reported balances are contractual and undiscounted figures. With regards to forward foreign
currency contracts, the tables relating to assets report the flows relative to only receivables. These amounts will be
counterbalanced by the payables, as reported in the tables relating to liabilities.
(Amounts in thousands of Euro)
Less than
1 year
From 1 to
3 years
From 3 to
5 years
Beyond
5 years
As of December 31, 2013
Cash and cash equivalents 617,995
—
—
—
Derivatives receivable 6,039
—
—
—
Accounts receivable 680,296
—
—
—
Other current assets
84,546
—
—
—
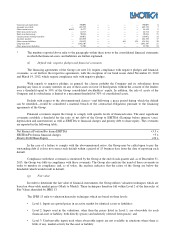
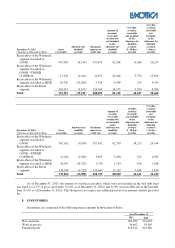
(Amounts in thousands of Euro)
Less than
1 year
From 1 to
3 years
From 3 to
5 years
Beyond
5 years
As of December 31, 2012
Cash and cash equivalents 790,093
—
—
—
Derivatives receivable 6,048
—
—
—
Accounts receivable 698,755
—
—
—
Other current assets
48,377
—
—
—
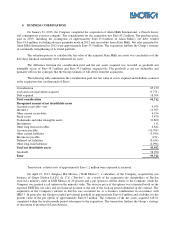
(Amounts in thousands of Euro)
Less than
1 year
From 1 to
3 years
From 3 to
5 years
Beyond
5 years
As of December 31, 2013
Debt owed to banks and other financial institutions 334,964
613,565
191,511
894,470
Derivatives payable 1,471
—
—
—
Accounts payable 681,151
—
—
—
Other current liabilities 473,411
—
—
—
(Amounts in thousands of Euro)
Less than
1 year
From 1 to
3 years
From 3 to
5 years
Beyond
5 years
As of December 31, 2012
Debt owed to banks and other financial institutions 416,538
1,107,256
229,120
1,086,670
Derivatives payable 1,119
—
—
—
Accounts payable 682,588
—
—
—
Other current liabilities 534,422
—
—
—
(e) Interest rate risk
The interest rate risk to which the Group is exposed primarily originates from long-term debt. Such debt
accrues interest at both fixed and floating rates.