LensCrafters 2013 Annual Report Download - page 199
Download and view the complete annual report
Please find page 199 of the 2013 LensCrafters annual report below. You can navigate through the pages in the report by either clicking on the pages listed below, or by using the keyword search tool below to find specific information within the annual report.-
 1
1 -
2
-
3
-
4
-
5
-
6
-
7
-
8
-
9
-
10
-
11
-
12
-
13
-
14
-
15
-
16
-
17
-
18
-
19
-
20
-
21
-
22
-
23
-
24
-
25
-
26
-
27
-
28
-
29
-
30
-
31
-
32
-
33
-
34
-
35
-
36
-
37
-
38
-
39
-
40
-
41
-
42
-
43
-
44
-
45
-
46
-
47
-
48
-
49
-
50
-
51
-
52
-
53
-
54
-
55
-
56
-
57
-
58
-
59
-
60
-
61
-
62
-
63
-
64
-
65
-
66
-
67
-
68
-
69
-
70
-
71
-
72
-
73
-
74
-
75
-
76
-
77
-
78
-
79
-
80
-
81
-
82
-
83
-
84
-
85
-
86
-
87
-
88
-
89
-
90
-
91
-
92
-
93
-
94
-
95
-
96
-
97
-
98
-
99
-
100
-
101
-
102
-
103
-
104
-
105
-
106
-
107
-
108
-
109
-
110
-
111
-
112
-
113
-
114
-
115
-
116
-
117
-
118
-
119
-
120
-
121
-
122
-
123
-
124
-
125
-
126
-
127
-
128
-
129
-
130
-
131
-
132
-
133
-
134
-
135
-
136
-
137
-
138
-
139
-
140
-
141
-
142
-
143
-
144
-
145
-
146
-
147
-
148
-
149
-
150
-
151
-
152
-
153
-
154
-
155
-
156
-
157
-
158
-
159
-
160
-
161
-
162
-
163
-
164
-
165
-
166
-
167
-
168
-
169
-
170
-
171
-
172
-
173
-
174
-
175
-
176
-
177
-
178
-
179
-
180
-
181
-
182
-
183
-
184
-
185
-
186
-
187
-
188
-
 189
189 -
 190
190 -
 191
191 -
 192
192 -
 193
193 -
 194
194 -
 195
195 -
 196
196 -
 197
197 -
 198
198 -
 199
199 -
 200
200 -
 201
201 -
 202
202 -
 203
203 -
 204
204 -
 205
205 -
 206
206 -
 207
207 -
 208
208 -
 209
209 -
210
-
211
-
212
-
213
-
214
-
215
-
216
-
217
-
218
-
219
-
220
-
221
-
222
-
223
-
224
-
225
-
226
-
227
-
228
-
229
-
230
-
231
-
232
-
233
-
234
-
235
-
236
-
237
-
238
-
239
-
240
-
241
-
242
-
243
-
244
-
245
-
246
-
247
-
248
-
249
-
250
-
251
-
252
-
253
 |
 |

Footnotes to the statutory financial statements as of December 31, 2013 Page 32 of 71
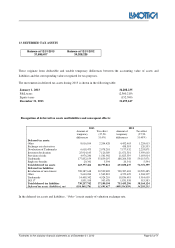
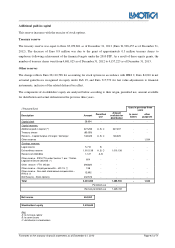
13. DEFERRED TAX ASSETS
Balance at 12/31/201
3
Balance at
12/31/2012
31,695,617
34,208,235
These originate from deductible and taxable temporary differences between the accounting value of assets and
liabilities and the corresponding value recognized for tax purposes.
The movements in deferred tax assets during 2013 is shown in the following table:
January 1, 2013 34,208,235
P&L taxes (2,360,219)
Equity taxes (152,399)
December 31, 2013 31,695,617
Recognition of deferred tax assets and liabilities and consequent effects:
2013 2012
Amount of
temporary
differences
Tax effect
(27,50-
31,4%)
Amount of
temporary
differences
Tax effect
(27,50-
31.40%)
Deferred tax assets:
Other 8,016,104 2,204,428 4,452,463 1,224,613
Exchange rate derivatives - - 438,303 120,533
Devaluation of Trademarks 6,618,473 2,078,201 7,177,932 2,253,871
Inventory devaluation 25,914,143 7,126,389 21,671,501 5,959,663
Provision of risks 4,976,246 1,541,902 11,825,339 3,693,014
Trademarks 177,832,159 55,839,297 188,264,558 59,115,071
Employee benefits 20,341 5,594 20,341 5,594
Total deferred tax assets 223,377,466 68,795,811 233,850,437 72,372,359
Deferred tax liabilities:
Revaluation of investments 708,387,618 30,529,485 708,387,618 30,529,485
Other 5,610,224 1,542,812 4,379,625 1,204,397
Trademarks 14,408,342 4,524,219 18,836,495 5,914,659
IAS 17 1,831,558 503,678 1,831,558 515,583
Total deferred tax liabilities 730,237,742 37,100,194 733,435,296 38,164,124
Deferred tax assets (liabilities), net (506,860,276) 31,695,617 (499,584,859) 34,208,235
In the deferred tax assets and liabilities, “Other”consist mainly of valuation exchange rate.