LensCrafters 2013 Annual Report Download - page 126
Download and view the complete annual report
Please find page 126 of the 2013 LensCrafters annual report below. You can navigate through the pages in the report by either clicking on the pages listed below, or by using the keyword search tool below to find specific information within the annual report.-
 1
1 -
2
-
3
-
4
-
5
-
6
-
7
-
8
-
9
-
10
-
11
-
12
-
13
-
14
-
15
-
16
-
17
-
18
-
19
-
20
-
21
-
22
-
23
-
24
-
25
-
26
-
27
-
28
-
29
-
30
-
31
-
32
-
33
-
34
-
35
-
36
-
37
-
38
-
39
-
40
-
41
-
42
-
43
-
44
-
45
-
46
-
47
-
48
-
49
-
50
-
51
-
52
-
53
-
54
-
55
-
56
-
57
-
58
-
59
-
60
-
61
-
62
-
63
-
64
-
65
-
66
-
67
-
68
-
69
-
70
-
71
-
72
-
73
-
74
-
75
-
76
-
77
-
78
-
79
-
80
-
81
-
82
-
83
-
84
-
85
-
86
-
87
-
88
-
89
-
90
-
91
-
92
-
93
-
94
-
95
-
96
-
97
-
98
-
99
-
100
-
101
-
102
-
103
-
104
-
105
-
106
-
107
-
108
-
109
-
110
-
111
-
112
-
113
-
114
-
115
-
 116
116 -
 117
117 -
 118
118 -
 119
119 -
 120
120 -
 121
121 -
 122
122 -
 123
123 -
 124
124 -
 125
125 -
 126
126 -
 127
127 -
 128
128 -
 129
129 -
 130
130 -
 131
131 -
 132
132 -
 133
133 -
 134
134 -
 135
135 -
 136
136 -
137
-
138
-
139
-
140
-
141
-
142
-
143
-
144
-
145
-
146
-
147
-
148
-
149
-
150
-
151
-
152
-
153
-
154
-
155
-
156
-
157
-
158
-
159
-
160
-
161
-
162
-
163
-
164
-
165
-
166
-
167
-
168
-
169
-
170
-
171
-
172
-
173
-
174
-
175
-
176
-
177
-
178
-
179
-
180
-
181
-
182
-
183
-
184
-
185
-
186
-
187
-
188
-
189
-
190
-
191
-
192
-
193
-
194
-
195
-
196
-
197
-
198
-
199
-
200
-
201
-
202
-
203
-
204
-
205
-
206
-
207
-
208
-
209
-
210
-
211
-
212
-
213
-
214
-
215
-
216
-
217
-
218
-
219
-
220
-
221
-
222
-
223
-
224
-
225
-
226
-
227
-
228
-
229
-
230
-
231
-
232
-
233
-
234
-
235
-
236
-
237
-
238
-
239
-
240
-
241
-
242
-
243
-
244
-
245
-
246
-
247
-
248
-
249
-
250
-
251
-
252
-
253
 |
 |

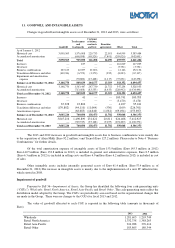
Total 3,045,216
3,148,770
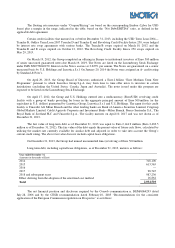
The reduction in goodwill, mainly due to the weakening of the Euro which is the currency in which the Group
operates (Euro 170.2 million), was partially offset by the increases due to the acquisition of Alain Mikli for Euro 58.7
million and of Devlyn for Euro 6.0 million.
The information required by paragraph 134 of IAS 36 is provided below only for the Wholesale and Retail
North America CGUs, since the value of goodwill allocated to these two units is a significant component of the Group’s
total goodwill.
The recoverable amount of each CGU has been verified by comparing its net assets carrying amounts to its
value in use.
The main assumptions for determining the value in use are reported below and refer to both cash generating
units:
• Growth rate:2.0% (2.0% as of December 31, 2012)
• Discount rate: 7.5% ( 7.8% as of December 31, 2012)
The above long-term average growth rate does not exceed the rate which is estimated for the products,
industries, and countries in which the Group operates.
The discount rate has been determined on the basis of market information on the cost of money and the
specific risk of the industry (Weighted Average Cost of Capital, WACC). In particular, the Group used a methodology
to determine the discount rate which was in line with that utilized in the previous year, considering the rates of return on
long-term government bonds and the average capital structure of a group of comparable companies.
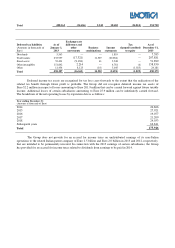
The recoverable amount of cash-generating units has been determined by utilizing post-tax cash flow forecasts
based on the Group’s 2014-2016 three-year plan, on the basis of the results attained in previous years as well as
management expectations—split by geographical area—regarding future trends in the eyewear market for both the
Wholesale and Retail distribution segments. At the end of the three-year projected cash flow period, a terminal value
was estimated in order to reflect the value of the CGU in future years. The terminal values were calculated as a
perpetuity at the same growth rate as described above and represent the present value, in the last year of the forecast, of
all future perpetual cash flows. The impairment test performed as of the balance sheet date resulted in a recoverable
value greater than the carrying amount (net operating assets) of the abovementioned CGUs. In percentage terms, the
surplus of the recoverable amount of the CGU over the carrying amount was equal to 514% and 28% of the carrying
amount of the Wholesale and Retail North America cash-generating units, respectively. A reduction in the recoverable
amount of the cash generating unit to a value that equals its carrying amount would require either of the following:
(i) an increase in the discount rate to approximately 32.7% for Wholesale and 9.05% for Retail North America; or
(ii) the utilization of a negative growth rate for Wholesale and zero for Retail North America.
In addition, reasonable changes to the abovementioned assumptions used to determine the recoverable amount
(i.e., growth rate changes of +/-0.5 percent and discount rate changes of +/-0.5 percent) would not significantly affect
the impairment test results.
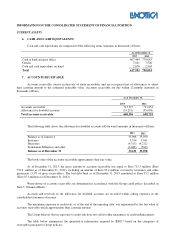
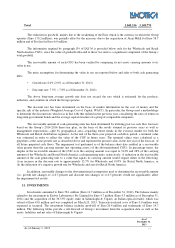
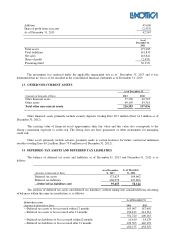
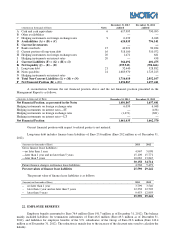
12. INVESTMENTS
Investments amounted to Euro 58.1 million (Euro 11.7 million as of December 31, 2012). The balance mainly
related to the investment in Eyebiz Laboratories Pty Limited for Euro 4.7 million (Euro 4.3 million as of December 31,
2012) and the acquisition of the 36.33% equity stake in Salmoiraghi & Viganò, an Italian optical retailer, which was
valued at Euro 45.0 million and was completed on March 25, 2013. Transaction related costs of Euro 0.9 million were
expensed as incurred. The investment balance includes goodwill of Euro 20.4 million and trademarks of Euro 14.7
million. The following tables provide a roll-forward of Group’s investment from the acquisition date as well as the
assets, liabilities and net sales of Salmoiraghi & Viganò:
As of
December 31,
2013
As of January 1, 2013 —