LensCrafters 2013 Annual Report Download - page 11
Download and view the complete annual report
Please find page 11 of the 2013 LensCrafters annual report below. You can navigate through the pages in the report by either clicking on the pages listed below, or by using the keyword search tool below to find specific information within the annual report.-
 1
1 -
 2
2 -
 3
3 -
 4
4 -
 5
5 -
 6
6 -
 7
7 -
 8
8 -
 9
9 -
 10
10 -
 11
11 -
 12
12 -
 13
13 -
 14
14 -
 15
15 -
 16
16 -
 17
17 -
 18
18 -
 19
19 -
 20
20 -
 21
21 -
 22
22 -
23
-
24
-
25
-
26
-
27
-
28
-
29
-
30
-
31
-
32
-
33
-
34
-
35
-
36
-
37
-
38
-
39
-
40
-
41
-
42
-
43
-
44
-
45
-
46
-
47
-
48
-
49
-
50
-
51
-
52
-
53
-
54
-
55
-
56
-
57
-
58
-
59
-
60
-
61
-
62
-
63
-
64
-
65
-
66
-
67
-
68
-
69
-
70
-
71
-
72
-
73
-
74
-
75
-
76
-
77
-
78
-
79
-
80
-
81
-
82
-
83
-
84
-
85
-
86
-
87
-
88
-
89
-
90
-
91
-
92
-
93
-
94
-
95
-
96
-
97
-
98
-
99
-
100
-
101
-
102
-
103
-
104
-
105
-
106
-
107
-
108
-
109
-
110
-
111
-
112
-
113
-
114
-
115
-
116
-
117
-
118
-
119
-
120
-
121
-
122
-
123
-
124
-
125
-
126
-
127
-
128
-
129
-
130
-
131
-
132
-
133
-
134
-
135
-
136
-
137
-
138
-
139
-
140
-
141
-
142
-
143
-
144
-
145
-
146
-
147
-
148
-
149
-
150
-
151
-
152
-
153
-
154
-
155
-
156
-
157
-
158
-
159
-
160
-
161
-
162
-
163
-
164
-
165
-
166
-
167
-
168
-
169
-
170
-
171
-
172
-
173
-
174
-
175
-
176
-
177
-
178
-
179
-
180
-
181
-
182
-
183
-
184
-
185
-
186
-
187
-
188
-
189
-
190
-
191
-
192
-
193
-
194
-
195
-
196
-
197
-
198
-
199
-
200
-
201
-
202
-
203
-
204
-
205
-
206
-
207
-
208
-
209
-
210
-
211
-
212
-
213
-
214
-
215
-
216
-
217
-
218
-
219
-
220
-
221
-
222
-
223
-
224
-
225
-
226
-
227
-
228
-
229
-
230
-
231
-
232
-
233
-
234
-
235
-
236
-
237
-
238
-
239
-
240
-
241
-
242
-
243
-
244
-
245
-
246
-
247
-
248
-
249
-
250
-
251
-
252
-
253
 |
 |

6
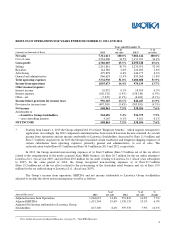
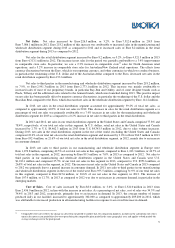
Gross Profit. Our gross profit increased by Euro 138.8 million, or 3.0%, to Euro 4,788.6 million in 2013 from
Euro 4,650.1 million in 2012. As a percentage of net sales, gross profit was 65.5% and 65.6% in 2013 and 2012, respectively,
due to the factors noted above.
Operating Expenses. Total operating expenses increased by Euro 52.9 million, or 1.4%, to Euro 3,732.9 million in
2013 from Euro 3,680.0 million in 2012. As a percentage of net sales, operating expenses were 51.0% in 2013 compared to
51.9% in 2012. Total adjusted operating expenses
11
increased by Euro 64.3 million, or 1.8%, to Euro 3,723.9 million in 2013
from Euro 3,659.7 million in 2012. As a percentage of net sales, adjusted operating expenses decreased to 50.9% in 2013
from 51.6% in 2012.
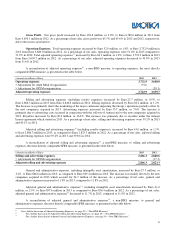
A reconciliation of adjusted operating expenses
11
, a non-IFRS measure, to operating expenses, the most directly
comparable IFRS measure, is presented in the table below.
(Amounts in millions of Euro)
2013
2012
Operating expenses
3,732.9
3,680.0
> Adjustment for Alain Mikli reorganization
(9.0)
-
> Adjustment for OPSM reorganization
-
(20.3)
Adjusted operating expenses
3,723.9
3,659.7
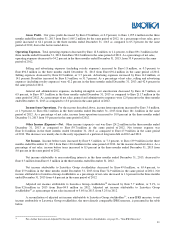
Selling and advertising expenses (including royalty expenses) increased by Euro 25.7 million, or 0.9%, to
Euro 2,866.3 million in 2013 from Euro 2,840.6 million in 2012. Selling expenses decreased by Euro 28.2 million, or 1.2%.
The decrease was primarily dueto the weakening of the major currencies impacting the Group’s operations partially offset by
the new companies acquired in 2013. Advertising expenses increased by Euro 33.7 million, or 7.6%. The increase is
primarily due to advertising costs incurred in connection with the roll-out of Armani and to the new companies acquired in
2013. Royalties increased by Euro 20.2 million, or 16.2%. The increase was primarily due to royalties under the Armani
license agreement which started in 2013. As a percentage of net sales, selling and advertising expenses were 39.2% in 2013
and 40.1% in 2012.
Adjusted selling and advertising expenses
12
(including royalty expenses), increased by Euro 43.0 million, or 1.5%,
to Euro 2,866.3 million in 2013, as compared to Euro 2,823.3 million in 2012. As a percentage of net sales, adjusted selling
and advertising expenses were 39.2% in 2013 and 39.8% in 2012.
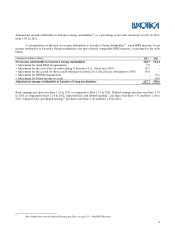
A reconciliation of adjusted selling and advertising expenses
12
, a non-IFRS measure, to selling and advertising
expenses, the most directly comparable IFRS measure, is presented in the table below.
(Amounts in millions of Euro)
2013
2012
Selling and advertising expenses
2,866.3
2,840.6
> Adjustment for OPSM reorganization
-
(17.3)
Adjusted selling and advertising expenses
2,866.3
2,823.3
General and administrative expenses, including intangible asset amortization, increased by Euro 27.3 million, or
3.2%, to Euro 866.6 million in 2013, as compared to Euro 839.4 million in 2012. The increase was mainly driven by the new
companies acquired in 2013 which account for 24.7 million of the increase. As a percentage of net sales, general and
administrative expenses increased to 11.9% in 2013, compared to 11.8% in 2012.
Adjusted general and administrative expenses
13
, including intangible asset amortization increased by Euro 21.2
million, or 2.5%, to Euro 857.6 million in 2013 as compared to Euro 836.4 million in 2012. As a percentage of net sales,
adjusted general and administrative expenses
13
decreased to 11.7% in 2013, compared to 11.8% in 2012.
A reconciliation of adjusted general and administrative expenses
13
, a non-IFRS measure, to general and
administrative expenses, the most directly comparable IFRS measure, is presented in the table below.
11
For a further discussion of Adjusted Operating Expenses, see page 29—“Non-IFRS Measures”.
12
For a further discussion of Adjusted Selling and Advertising Expenses, see page 29—“Non-IFRS Measures”.
13
For a further discussion of Adjusted General and Administrative Expenses, see page 29—“Non-IFRS Measures”.