LensCrafters 2013 Annual Report Download - page 124
Download and view the complete annual report
Please find page 124 of the 2013 LensCrafters annual report below. You can navigate through the pages in the report by either clicking on the pages listed below, or by using the keyword search tool below to find specific information within the annual report.-
 1
1 -
2
-
3
-
4
-
5
-
6
-
7
-
8
-
9
-
10
-
11
-
12
-
13
-
14
-
15
-
16
-
17
-
18
-
19
-
20
-
21
-
22
-
23
-
24
-
25
-
26
-
27
-
28
-
29
-
30
-
31
-
32
-
33
-
34
-
35
-
36
-
37
-
38
-
39
-
40
-
41
-
42
-
43
-
44
-
45
-
46
-
47
-
48
-
49
-
50
-
51
-
52
-
53
-
54
-
55
-
56
-
57
-
58
-
59
-
60
-
61
-
62
-
63
-
64
-
65
-
66
-
67
-
68
-
69
-
70
-
71
-
72
-
73
-
74
-
75
-
76
-
77
-
78
-
79
-
80
-
81
-
82
-
83
-
84
-
85
-
86
-
87
-
88
-
89
-
90
-
91
-
92
-
93
-
94
-
95
-
96
-
97
-
98
-
99
-
100
-
101
-
102
-
103
-
104
-
105
-
106
-
107
-
108
-
109
-
110
-
111
-
112
-
113
-
 114
114 -
 115
115 -
 116
116 -
 117
117 -
 118
118 -
 119
119 -
 120
120 -
 121
121 -
 122
122 -
 123
123 -
 124
124 -
 125
125 -
 126
126 -
 127
127 -
 128
128 -
 129
129 -
 130
130 -
 131
131 -
 132
132 -
 133
133 -
 134
134 -
135
-
136
-
137
-
138
-
139
-
140
-
141
-
142
-
143
-
144
-
145
-
146
-
147
-
148
-
149
-
150
-
151
-
152
-
153
-
154
-
155
-
156
-
157
-
158
-
159
-
160
-
161
-
162
-
163
-
164
-
165
-
166
-
167
-
168
-
169
-
170
-
171
-
172
-
173
-
174
-
175
-
176
-
177
-
178
-
179
-
180
-
181
-
182
-
183
-
184
-
185
-
186
-
187
-
188
-
189
-
190
-
191
-
192
-
193
-
194
-
195
-
196
-
197
-
198
-
199
-
200
-
201
-
202
-
203
-
204
-
205
-
206
-
207
-
208
-
209
-
210
-
211
-
212
-
213
-
214
-
215
-
216
-
217
-
218
-
219
-
220
-
221
-
222
-
223
-
224
-
225
-
226
-
227
-
228
-
229
-
230
-
231
-
232
-
233
-
234
-
235
-
236
-
237
-
238
-
239
-
240
-
241
-
242
-
243
-
244
-
245
-
246
-
247
-
248
-
249
-
250
-
251
-
252
-
253
 |
 |
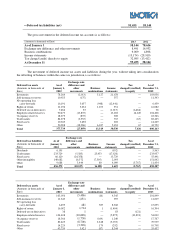
NON-CURRENT ASSETS
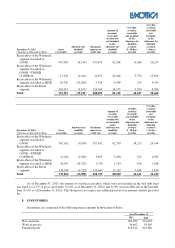
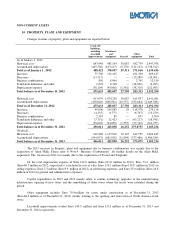
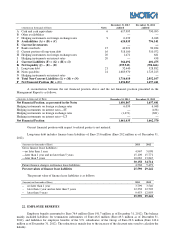
10. PROPERTY, PLANT AND EQUIPMENT
Changes in items of property, plant and equipment are reported below:
Land and
buildings,
including
leasehold
improvements
Machinery
and
equipment
Aircraft
Other
equipment
Total
As of January 1, 2012
Historical cost 893,948
983,164
38,087
582,779
2,497,978
Accumulated depreciation (405,526)
(613,127)
(8,776)
(311,113)
(1,338,542)
Total as of January 1 , 2012 488,422
370,037
29,311
271,666
1,159,436
Increases 55,700
112,415
—
101,300
269,415
Decreases (13,713)
—
—
(15,288)
(29,001)
Business combinations 850
8,904
—
2,765
12,519
Translation difference and other 2,478
9,349
—
(18,820)
(6,993)
Depreciation expense (58,104)
(95,008)
(1,561)
(58,310)
(212,983)
Total balance as of December 31, 2012 475,633
405,697
27,750
283,313
1,192,394
Historical cost 913,679
1,074,258
38,087
615,957
2,641,981
Accumulated depreciation (438,046)
(668,561)
(10,337)
(332,644)
(1,449,588)
Total as of December 31, 2012 475,633
405,697
27,750
283,313
1,192,394
Increases 49,600
105,885
58
118,570
274,114
Decreases (4,235)
(4,337)
—
(6,707)
(15,279)
Business combinations 2,367
85
—
857
3,309
Translation difference and other (7,751)
12,423
—
(63,217)
(58,545)
Depreciation expense (59,603)
(93,856)
(1,555)
(57,742)
(212,757)
Total balance as of December 31, 2012 456,011
425,898
26,252
275,0751
1,183,236
Of which:
Historical cost 910,968
1,107,816
38,145
612,555
2,669,485
Accumulated depreciation (454,957)
(681,918)
(11,894)
(337,480)
(1,486,249)
Total balance as of December 31, 2013
456,011
425,898
26,252
275,075
1,183,236
The 2013 increase in Property, plant and equipment due to business combinations was mainly due to the
acquisition of Alain Mikli. Please refer to Note 4 “Business Combinations” for further details on the Alain Mikli
acquisition. The increase in 2012 was mainly due to the acquisitions of Tecnol and Sunplanet.
Of the total depreciation expense of Euro 212.8 million (Euro 213.0 million in 2012), Euro 72.3 million
(Euro 69.5 million in 2012, respectively) is included in cost of sales, Euro 110.1 million (Euro114.8 million in 2012) in
selling expenses; Euro 5.3 million (Euro3.9 million in 2012) in advertising expenses; and Euro 25.0 million (Euro 24.8
million in 2012) in general and administrative expenses.
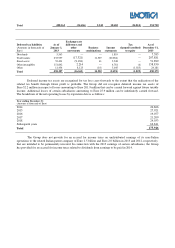
Capital expenditures in 2013 and 2012 mainly relate to routine technology upgrades to the manufacturing
infrastructure, opening of new stores and the remodeling of older stores where the leases were extended during the
period.
Other equipment includes Euro 70.9 million for assets under construction as of December 31, 2013
(Euro 66.9 million as of December 31, 2012) mainly relating to the opening and renovation of North America retail
stores.
Leasehold improvements totaled Euro 149.5 million and Euro 153.1 million as of December 31, 2013 and
December 31, 2012 respectively.