LensCrafters 2013 Annual Report Download - page 12
Download and view the complete annual report
Please find page 12 of the 2013 LensCrafters annual report below. You can navigate through the pages in the report by either clicking on the pages listed below, or by using the keyword search tool below to find specific information within the annual report.-
 1
1 -
 2
2 -
 3
3 -
 4
4 -
 5
5 -
 6
6 -
 7
7 -
 8
8 -
 9
9 -
 10
10 -
 11
11 -
 12
12 -
 13
13 -
 14
14 -
 15
15 -
 16
16 -
 17
17 -
 18
18 -
 19
19 -
 20
20 -
 21
21 -
 22
22 -
23
-
24
-
25
-
26
-
27
-
28
-
29
-
30
-
31
-
32
-
33
-
34
-
35
-
36
-
37
-
38
-
39
-
40
-
41
-
42
-
43
-
44
-
45
-
46
-
47
-
48
-
49
-
50
-
51
-
52
-
53
-
54
-
55
-
56
-
57
-
58
-
59
-
60
-
61
-
62
-
63
-
64
-
65
-
66
-
67
-
68
-
69
-
70
-
71
-
72
-
73
-
74
-
75
-
76
-
77
-
78
-
79
-
80
-
81
-
82
-
83
-
84
-
85
-
86
-
87
-
88
-
89
-
90
-
91
-
92
-
93
-
94
-
95
-
96
-
97
-
98
-
99
-
100
-
101
-
102
-
103
-
104
-
105
-
106
-
107
-
108
-
109
-
110
-
111
-
112
-
113
-
114
-
115
-
116
-
117
-
118
-
119
-
120
-
121
-
122
-
123
-
124
-
125
-
126
-
127
-
128
-
129
-
130
-
131
-
132
-
133
-
134
-
135
-
136
-
137
-
138
-
139
-
140
-
141
-
142
-
143
-
144
-
145
-
146
-
147
-
148
-
149
-
150
-
151
-
152
-
153
-
154
-
155
-
156
-
157
-
158
-
159
-
160
-
161
-
162
-
163
-
164
-
165
-
166
-
167
-
168
-
169
-
170
-
171
-
172
-
173
-
174
-
175
-
176
-
177
-
178
-
179
-
180
-
181
-
182
-
183
-
184
-
185
-
186
-
187
-
188
-
189
-
190
-
191
-
192
-
193
-
194
-
195
-
196
-
197
-
198
-
199
-
200
-
201
-
202
-
203
-
204
-
205
-
206
-
207
-
208
-
209
-
210
-
211
-
212
-
213
-
214
-
215
-
216
-
217
-
218
-
219
-
220
-
221
-
222
-
223
-
224
-
225
-
226
-
227
-
228
-
229
-
230
-
231
-
232
-
233
-
234
-
235
-
236
-
237
-
238
-
239
-
240
-
241
-
242
-
243
-
244
-
245
-
246
-
247
-
248
-
249
-
250
-
251
-
252
-
253
 |
 |

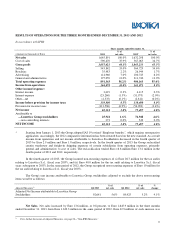
7
(Amounts in millions of Euro)
2013
2012
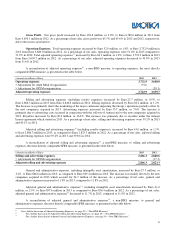
General and administrative expenses
866.6
839.4
> Adjustment for Alain Mikli reorganization
(9.0)
-
> Adjustment for OPSM reorganization
-
(3.0)
Adjusted general and administrative expenses
857.6
836.4
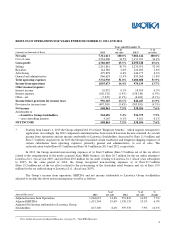
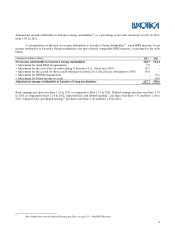
Income from Operations. For the reasons described above, income from operations increased by Euro 85.5
million, or 8.8%, to Euro 1,055.7 million in 2013 from Euro 970.1 million in 2012. As a percentage of net sales, income from
operations increased to 14.4% in 2013 from 13.7% in 2012. Adjusted income from operations
14
increased by Euro 72.8
million, or 7.3%, to Euro 1,064.7 million in 2013 from Euro 991.8 million in 2012. As a percentage of net sales, adjusted
income from operations
14
increased to 14.6% in 2013 from 14.0% in 2012.
A reconciliation of adjusted income from operations
14
, a non-IFRS measure, to income from operations, the most
directly comparable IFRS measure, is presented in the table below. For a further discussion of such non-IFRS measures,
please refer to the “Non-IFRS Measures: Adjusted Measures” discussion following the year-over-year comparisons.
(Amounts in millions of Euro)
2013
2012
Income from operations
1,055.7
970.1
> Adjustment for Alain Mikli reorganization
9.0
-
> Adjustment for OPSM reorganization
-
21.7
Adjusted income from operations
1,064.7
991.8
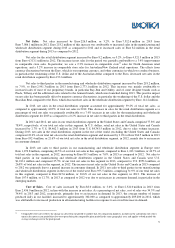
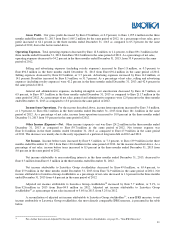
Other Income (Expense)—Net. Other income (expense)—net was Euro (99.3) million in 2013 as compared to
Euro (125.7) million in 2012. Net interest expense was Euro 92.1 million in 2013 as compared to Euro 119.2 million in 2012.
The decrease was mainly due to the early repayment of a portion of long-term debt in 2012 and 2013.
Net Income. Income before taxes increased by Euro 111.9 million, or 13.3%, to Euro 956.4 million in 2013 from
Euro 844.4 million in 2012 for the reasons described above. As a percentage of net sales, income before taxes increased to
13.1% in 2013, from 11.9% in 2012. Adjusted income before taxes
15
increased by Euro 99.2 million, or 11.5%, to
Euro 965.4 million in 2013, from Euro 866.2 million in 2012 for the reasons described above. As a percentage of net sales,
adjusted income before taxes
15
increased to 13.2% in 2013 from 12.2% in 2012.
A reconciliation of adjusted net income before taxes
15
, a non-IFRS measure, to net income before taxes, the most
directly comparable IFRS measure, is presented in the table below.
(Amounts in millions of Euro)
2013
2012
Net income before taxes
956.4
844.4
> Adjustment for Alain Mikli reorganization
9.0
-
> Adjustment for OPSM reorganization
-
21.7
Adjusted net income before taxes
965.4
866.2
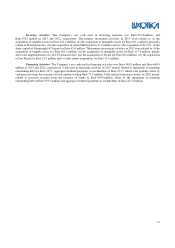
Our effective tax rate was 42.6% and 36.2% in 2013 and 2012, respectively. Included in 2013, was Euro 66.7
million for certain income taxes accrued in the period as a result of ongoing tax audits as compared with Euro 10.0 million
accrued in 2012.
Net income attributable to non-controlling interests was equal to Euro 4.2 million in each of 2013 and 2012.
Net income attributable to Luxottica Group stockholders increased by Euro 10.3 million, or 1.9%, to
Euro 544.7 million in 2013 from Euro 534.4 million in 2012. Net income attributable to Luxottica Group stockholders as a
percentage of net sales decreased to 7.4% in 2013 from 7.5% in 2012. Adjusted net income attributable to Luxottica Group
stockholders
16
increased by Euro 57.7 million, or 10.3%, to Euro 617.3 million in 2013 from Euro 559.6 million in 2012.
14
For a further discussion of Adjusted Income from Operations, see page 29—“Non-IFRS Measures”.
15
For a further discussion of Adjusted Income before taxes, see page 29—“Non-IFRS Measures”.
16
For a further discussion of Adjusted Net Income Attributable to Luxottica Stockholders, see page 29—“Non-IFRS Measures”.