LensCrafters 2013 Annual Report Download - page 119
Download and view the complete annual report
Please find page 119 of the 2013 LensCrafters annual report below. You can navigate through the pages in the report by either clicking on the pages listed below, or by using the keyword search tool below to find specific information within the annual report.-
 1
1 -
2
-
3
-
4
-
5
-
6
-
7
-
8
-
9
-
10
-
11
-
12
-
13
-
14
-
15
-
16
-
17
-
18
-
19
-
20
-
21
-
22
-
23
-
24
-
25
-
26
-
27
-
28
-
29
-
30
-
31
-
32
-
33
-
34
-
35
-
36
-
37
-
38
-
39
-
40
-
41
-
42
-
43
-
44
-
45
-
46
-
47
-
48
-
49
-
50
-
51
-
52
-
53
-
54
-
55
-
56
-
57
-
58
-
59
-
60
-
61
-
62
-
63
-
64
-
65
-
66
-
67
-
68
-
69
-
70
-
71
-
72
-
73
-
74
-
75
-
76
-
77
-
78
-
79
-
80
-
81
-
82
-
83
-
84
-
85
-
86
-
87
-
88
-
89
-
90
-
91
-
92
-
93
-
94
-
95
-
96
-
97
-
98
-
99
-
100
-
101
-
102
-
103
-
104
-
105
-
106
-
107
-
108
-
 109
109 -
 110
110 -
 111
111 -
 112
112 -
 113
113 -
 114
114 -
 115
115 -
 116
116 -
 117
117 -
 118
118 -
 119
119 -
 120
120 -
 121
121 -
 122
122 -
 123
123 -
 124
124 -
 125
125 -
 126
126 -
 127
127 -
 128
128 -
 129
129 -
130
-
131
-
132
-
133
-
134
-
135
-
136
-
137
-
138
-
139
-
140
-
141
-
142
-
143
-
144
-
145
-
146
-
147
-
148
-
149
-
150
-
151
-
152
-
153
-
154
-
155
-
156
-
157
-
158
-
159
-
160
-
161
-
162
-
163
-
164
-
165
-
166
-
167
-
168
-
169
-
170
-
171
-
172
-
173
-
174
-
175
-
176
-
177
-
178
-
179
-
180
-
181
-
182
-
183
-
184
-
185
-
186
-
187
-
188
-
189
-
190
-
191
-
192
-
193
-
194
-
195
-
196
-
197
-
198
-
199
-
200
-
201
-
202
-
203
-
204
-
205
-
206
-
207
-
208
-
209
-
210
-
211
-
212
-
213
-
214
-
215
-
216
-
217
-
218
-
219
-
220
-
221
-
222
-
223
-
224
-
225
-
226
-
227
-
228
-
229
-
230
-
231
-
232
-
233
-
234
-
235
-
236
-
237
-
238
-
239
-
240
-
241
-
242
-
243
-
244
-
245
-
246
-
247
-
248
-
249
-
250
-
251
-
252
-
253
 |
 |

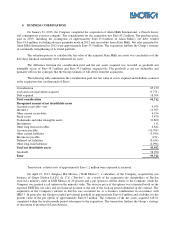
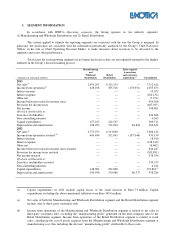
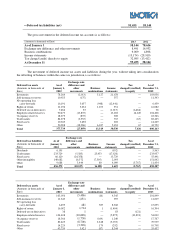
5. SEGMENT INFORMATION
In accordance with IFRS 8—Operating segments, the Group operates in two industry segments:
(1) Manufacturing and Wholesale Distribution, and (2) Retail Distribution.
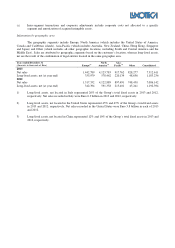
The criteria applied to identify the reporting segments are consistent with the way the Group is managed. In
particular, the disclosures are consistent with the information periodically analyzed by the Group’s Chief Executive
Officer, in his role as Chief Operating Decision Maker, to make decisions about resources to be allocated to the
segments and assess their performance.
Total assets for each reporting segment are no longer disclosed as they are not regularly reported to the highest
authority in the Group’s decision-making process.
(Amounts in thousands of Euro)
Manufacturing
and
Wholesale
Distribution
Retail
Distribution
Inter-segment
transactions
and corporate
adjustments
(c)
Consolidated
2013
Net sales
(a)
2,991,297
4,321,314
—
7,312,611
Income from operations
(b)
649,108
585,516
(178,951)
1,055,673
Interest income —
—
—
10,072
Interest expense —
—
—
(102,132)
Other-net —
—
—
(7,274)
Income before provision for income taxes —
—
—
956,366
Provision for income taxes —
—
—
(407,505)
Net income —
—
—
548,861
Of which attributable to: —
—
—
Luxottica stockholders —
—
—
544,696
Non-controlling interests —
—
—
4,165
Capital expenditures 157,165
212,547
369,711
Depreciation and amortization 108,993
172,804
84,834
366,631
2012
Net sales
(a)
2,773,073
4,313,069
—
7,086,142
Income from operations restated
(b)
604,494
552,691
(187,046)
970,139
Interest income —
—
—
18,910
Interest expense —
—
—
(138,140)
Other-net —
—
—
(6,463)
Income before provision for income taxes restated —
—
—
844,447
Provision for income taxes restated —
—
—
(305,891)
Net income restated —
—
—
538,556
Of which attributable to:
Luxottica stockholders restated —
—
—
534,375
Non-controlling interests —
—
—
4,181
Capital expenditures 148,001
224,890
—
372,891
(1)
Depreciation and amortization 100,956
170,988
86,337
358,281
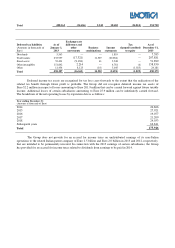
(1) Capital expenditures in 2012 include capital leases of the retail division of Euro 7.9 million. Capital
expenditures excluding the above-mentioned additions were Euro 365.0 million.
(a) Net sales of both the Manufacturing and Wholesale Distribution segment and the Retail Distribution segment
include sales to third- party customers only.
(b) Income from operations of the Manufacturing and Wholesale Distribution segment is related to net sales to
third-party customers only, excluding the “manufacturing profit” generated on the inter-company sales to the
Retail Distribution segment. Income from operations of the Retail Distribution segment is related to retail
sales, considering the cost of goods acquired from the Manufacturing and Wholesale Distribution segment at
manufacturing cost, thus including the relevant “manufacturing profit” attributable to those sales.