LensCrafters 2013 Annual Report Download - page 115
Download and view the complete annual report
Please find page 115 of the 2013 LensCrafters annual report below. You can navigate through the pages in the report by either clicking on the pages listed below, or by using the keyword search tool below to find specific information within the annual report.-
 1
1 -
2
-
3
-
4
-
5
-
6
-
7
-
8
-
9
-
10
-
11
-
12
-
13
-
14
-
15
-
16
-
17
-
18
-
19
-
20
-
21
-
22
-
23
-
24
-
25
-
26
-
27
-
28
-
29
-
30
-
31
-
32
-
33
-
34
-
35
-
36
-
37
-
38
-
39
-
40
-
41
-
42
-
43
-
44
-
45
-
46
-
47
-
48
-
49
-
50
-
51
-
52
-
53
-
54
-
55
-
56
-
57
-
58
-
59
-
60
-
61
-
62
-
63
-
64
-
65
-
66
-
67
-
68
-
69
-
70
-
71
-
72
-
73
-
74
-
75
-
76
-
77
-
78
-
79
-
80
-
81
-
82
-
83
-
84
-
85
-
86
-
87
-
88
-
89
-
90
-
91
-
92
-
93
-
94
-
95
-
96
-
97
-
98
-
99
-
100
-
101
-
102
-
103
-
104
-
 105
105 -
 106
106 -
 107
107 -
 108
108 -
 109
109 -
 110
110 -
 111
111 -
 112
112 -
 113
113 -
 114
114 -
 115
115 -
 116
116 -
 117
117 -
 118
118 -
 119
119 -
 120
120 -
 121
121 -
 122
122 -
 123
123 -
 124
124 -
 125
125 -
126
-
127
-
128
-
129
-
130
-
131
-
132
-
133
-
134
-
135
-
136
-
137
-
138
-
139
-
140
-
141
-
142
-
143
-
144
-
145
-
146
-
147
-
148
-
149
-
150
-
151
-
152
-
153
-
154
-
155
-
156
-
157
-
158
-
159
-
160
-
161
-
162
-
163
-
164
-
165
-
166
-
167
-
168
-
169
-
170
-
171
-
172
-
173
-
174
-
175
-
176
-
177
-
178
-
179
-
180
-
181
-
182
-
183
-
184
-
185
-
186
-
187
-
188
-
189
-
190
-
191
-
192
-
193
-
194
-
195
-
196
-
197
-
198
-
199
-
200
-
201
-
202
-
203
-
204
-
205
-
206
-
207
-
208
-
209
-
210
-
211
-
212
-
213
-
214
-
215
-
216
-
217
-
218
-
219
-
220
-
221
-
222
-
223
-
224
-
225
-
226
-
227
-
228
-
229
-
230
-
231
-
232
-
233
-
234
-
235
-
236
-
237
-
238
-
239
-
240
-
241
-
242
-
243
-
244
-
245
-
246
-
247
-
248
-
249
-
250
-
251
-
252
-
253
 |
 |

With regard to the risk arising from fixed-rate debt, the Group does not apply specific hedging policies since it
does not deem the risk to be material.
Floating-rate debt exposes the Group to a risk from the volatility of the interest rates (cash flow risk). In
relation to this risk, and for the purposes of the related hedging, the Group utilizes derivate contracts, specifically
Interest Rate Swap (IRS) agreements, which exchange the floating rate for a fixed rate, thereby reducing the risk from
interest rate volatility.
The risk policy of the Group requires the maintenance of a percentage of fixed-rate debt that is greater than
25% and less than 75% of total debt. This percentage is managed by entering into fixed rate debt agreements or by
utilizing IRS agreements, when required.
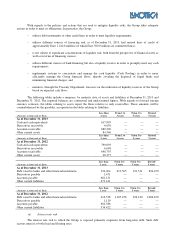
On the basis of various scenarios, the Group calculates the impact of rate changes on the consolidated
statement of income. For each scenario, the same interest rate change is utilized for all currencies. The various scenarios
only include those liabilities at floating rates that are not hedged with fixed interest rate swaps. On the basis of these
scenarios, the impact as of December 31, 2013 and net of tax effect of an increase/decrease of 100 basis points on net
income, in a situation with all other variables unchanged, would have been a maximum decrease of Euro 3.0 million
(Euro 3.0 million as of December 31, 2012) or a maximum increase of Euro 3.0 million (Euro 3.0 million as of
December 31, 2012).
All IRS agreements expired as of May 29, 2013. As of December 31, 2012, in the event that interest rates
increased/decreased by 100 basis points, with all other variables unchanged, the stockholders’ equity reserves would
have been greater/(lower) by Euro 0.2 million, net of tax effect in connection with the increase/decrease of the fair value
of the derivatives used for the cash flow hedges.
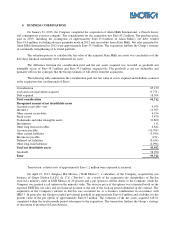
As of December 31, 2013
Plus 100 basis points
Minus 100 basis points
(Amounts in millions of Euro)
Net income
Reserve
Net income
Reserve
Liabilities (3.0)
—
3.0
—
Hedging derivatives (cash flow hedges) —
—
—
—
As of December 31, 2012
Plus 100 basis points
Minus 100 basis points
(Amounts in millions of Euro)
Net income
Reserve
Net income
Reserve
Liabilities (3.0)
—
3.0
—
Hedging derivatives (cash flow hedges) —
0.2
—
—
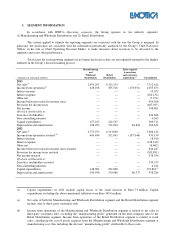
For the purposes of fully disclosing information about financial risks, a reconciliation between classes of
financial assets and liabilities and the types of financial assets and liabilities identified on the basis of IFRS 7
requirements is reported below (in thousands of Euro):
Financial
assets
at fair
value
through
profit and
loss
Loans and
receivables
Investments
held until
maturity
Financial
assets
available
for sale
Financial
liabilities
at
fair value
through
profit and
loss
Hedging
derivatives Total Note(*)
December 31, 2013
Cash and cash equivalents — 617,995 — — — — 617,995 6
Accounts receivable — 680,296 — — — — 680,296 7
Other current assets 6,039 84,546 — — — — 90,856 9
Other non-current assets — 57,390 — — — — 57,390 13
Short-term borrowings — 44,921 — — — — 44,921 15
Current portion of long-term debt — 318,100 — — — — 318,100 16
Accounts payable — 681,151 — — — — 681,151 17
Other current liabilities — 473,411 — — 1,471 474,882 20
Long-term debt — 1,716,410 — — — — 1,716,410 21
Other non-current liabilities — 71,688 — — — — 71,688 24
Financial
assets
at fair
value through
profit and loss
Loans and
receivables
Investments
held until
maturity
Financial
assets
available
for sale
Financial
liabilities at
fair value
through
profit and loss
Hedging
derivatives Total Note(*)
December 31, 2012