LensCrafters 2013 Annual Report Download - page 122
Download and view the complete annual report
Please find page 122 of the 2013 LensCrafters annual report below. You can navigate through the pages in the report by either clicking on the pages listed below, or by using the keyword search tool below to find specific information within the annual report.-
 1
1 -
2
-
3
-
4
-
5
-
6
-
7
-
8
-
9
-
10
-
11
-
12
-
13
-
14
-
15
-
16
-
17
-
18
-
19
-
20
-
21
-
22
-
23
-
24
-
25
-
26
-
27
-
28
-
29
-
30
-
31
-
32
-
33
-
34
-
35
-
36
-
37
-
38
-
39
-
40
-
41
-
42
-
43
-
44
-
45
-
46
-
47
-
48
-
49
-
50
-
51
-
52
-
53
-
54
-
55
-
56
-
57
-
58
-
59
-
60
-
61
-
62
-
63
-
64
-
65
-
66
-
67
-
68
-
69
-
70
-
71
-
72
-
73
-
74
-
75
-
76
-
77
-
78
-
79
-
80
-
81
-
82
-
83
-
84
-
85
-
86
-
87
-
88
-
89
-
90
-
91
-
92
-
93
-
94
-
95
-
96
-
97
-
98
-
99
-
100
-
101
-
102
-
103
-
104
-
105
-
106
-
107
-
108
-
109
-
110
-
111
-
 112
112 -
 113
113 -
 114
114 -
 115
115 -
 116
116 -
 117
117 -
 118
118 -
 119
119 -
 120
120 -
 121
121 -
 122
122 -
 123
123 -
 124
124 -
 125
125 -
 126
126 -
 127
127 -
 128
128 -
 129
129 -
 130
130 -
 131
131 -
 132
132 -
133
-
134
-
135
-
136
-
137
-
138
-
139
-
140
-
141
-
142
-
143
-
144
-
145
-
146
-
147
-
148
-
149
-
150
-
151
-
152
-
153
-
154
-
155
-
156
-
157
-
158
-
159
-
160
-
161
-
162
-
163
-
164
-
165
-
166
-
167
-
168
-
169
-
170
-
171
-
172
-
173
-
174
-
175
-
176
-
177
-
178
-
179
-
180
-
181
-
182
-
183
-
184
-
185
-
186
-
187
-
188
-
189
-
190
-
191
-
192
-
193
-
194
-
195
-
196
-
197
-
198
-
199
-
200
-
201
-
202
-
203
-
204
-
205
-
206
-
207
-
208
-
209
-
210
-
211
-
212
-
213
-
214
-
215
-
216
-
217
-
218
-
219
-
220
-
221
-
222
-
223
-
224
-
225
-
226
-
227
-
228
-
229
-
230
-
231
-
232
-
233
-
234
-
235
-
236
-
237
-
238
-
239
-
240
-
241
-
242
-
243
-
244
-
245
-
246
-
247
-
248
-
249
-
250
-
251
-
252
-
253
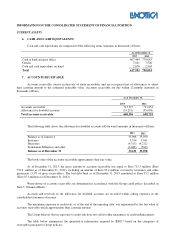
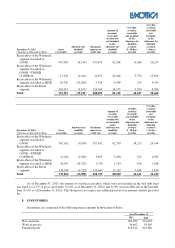
 |
 |
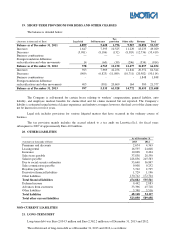
December 31, 2013
(Amounts in thousands of Euro)
Gross
receivables
Allowance for
doubtful
accounts
Maximum
exposure to
credit risk
Amount of
accounts
receivable
overdue but
not included
in the
allowance for
doubtful
accounts
Overdue
accounts
receivable
not included
in the
allowance for
doubtful
accounts
0 - 30 days
overdue
Overdue
accounts
receivable
not
included
in the
allowance for
doubtful
accounts
> 30 days
overdue
Receivables of the Wholesale
segment classified as
GOOD 543,789
(6,134)
537,655
41,298
31,060
10,237
Receivables of the Wholesale
segment classified as
GOOD—UNDER
CONTROL 15,176
(2,224)
12,951
21,046
5,752
15,294
Receivables of the Wholesale
segment classified as RISK
28,530
(23,200)
5,330
4,599
255
4,343
Receivables of the Retail
segment 128,033
(3,673)
124,360
14,173
5,590
8,586
Total 715,527
(35,231)
680,296
81,116
42,657
38,460
December 31, 2012
(Amounts in thousands of Euro)
Gross
receivables
Allowance for
doubtful
accounts
Maximum
exposure to
credit risk
Amount of
accounts
receivable
overdue but
not included
in the
allowance for
doubtful
accounts
Overdue
accounts
receivable
not included
in the
allowance for
doubtful
accounts
0 - 30 days
overdue
Overdue
accounts
receivable
not
included
in the
allowance for
doubtful
accounts
> 30 days
overdue
Receivables of the Wholesale
segment classified as
GOOD 567,162
(9,530)
557,632
62,558
38,215
24,344
Receivables of the Wholesale
segment classified as
GOOD—UNDER
CONTROL 12,224
(2,528)
9,695
3,438
515
2,923
Receivables of the Wholesale
segment classified as RISK 20,071
(18,712)
1,359
1,744
456
1,288
Receivables of the Retail
segment 134,398
(4,329)
130,069
13,120
7,446
5,674
Total 733,854
(35,098)
698,755
80,860
46,631
34,229
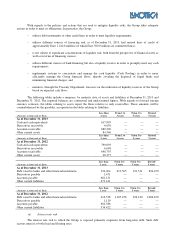
As of December 31, 2013, the amount of overdue receivables which were not included in the bad debt fund
was equal to 11.3% of gross receivables (11.0% as of December 31, 2012) and 11.9% of receivables net of the bad debt
fund (11.6% as of December 31, 2012). The Group does not expect any additional losses over amounts already provided
for.
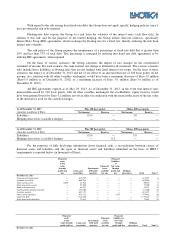
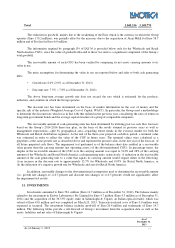
8. INVENTORIES
Inventories are comprised of the following items (amounts in thousands of Euro):
As of December 31
2013 2012
Raw materials 163,809
154,403
Work in process 36,462
59,565
Finished goods 612,814
625,386