LensCrafters 2013 Annual Report Download - page 21
Download and view the complete annual report
Please find page 21 of the 2013 LensCrafters annual report below. You can navigate through the pages in the report by either clicking on the pages listed below, or by using the keyword search tool below to find specific information within the annual report.-
 1
1 -
2
-
3
-
4
-
5
-
6
-
7
-
8
-
9
-
10
-
 11
11 -
 12
12 -
 13
13 -
 14
14 -
 15
15 -
 16
16 -
 17
17 -
 18
18 -
 19
19 -
 20
20 -
 21
21 -
 22
22 -
 23
23 -
 24
24 -
 25
25 -
 26
26 -
 27
27 -
 28
28 -
 29
29 -
 30
30 -
 31
31 -
32
-
33
-
34
-
35
-
36
-
37
-
38
-
39
-
40
-
41
-
42
-
43
-
44
-
45
-
46
-
47
-
48
-
49
-
50
-
51
-
52
-
53
-
54
-
55
-
56
-
57
-
58
-
59
-
60
-
61
-
62
-
63
-
64
-
65
-
66
-
67
-
68
-
69
-
70
-
71
-
72
-
73
-
74
-
75
-
76
-
77
-
78
-
79
-
80
-
81
-
82
-
83
-
84
-
85
-
86
-
87
-
88
-
89
-
90
-
91
-
92
-
93
-
94
-
95
-
96
-
97
-
98
-
99
-
100
-
101
-
102
-
103
-
104
-
105
-
106
-
107
-
108
-
109
-
110
-
111
-
112
-
113
-
114
-
115
-
116
-
117
-
118
-
119
-
120
-
121
-
122
-
123
-
124
-
125
-
126
-
127
-
128
-
129
-
130
-
131
-
132
-
133
-
134
-
135
-
136
-
137
-
138
-
139
-
140
-
141
-
142
-
143
-
144
-
145
-
146
-
147
-
148
-
149
-
150
-
151
-
152
-
153
-
154
-
155
-
156
-
157
-
158
-
159
-
160
-
161
-
162
-
163
-
164
-
165
-
166
-
167
-
168
-
169
-
170
-
171
-
172
-
173
-
174
-
175
-
176
-
177
-
178
-
179
-
180
-
181
-
182
-
183
-
184
-
185
-
186
-
187
-
188
-
189
-
190
-
191
-
192
-
193
-
194
-
195
-
196
-
197
-
198
-
199
-
200
-
201
-
202
-
203
-
204
-
205
-
206
-
207
-
208
-
209
-
210
-
211
-
212
-
213
-
214
-
215
-
216
-
217
-
218
-
219
-
220
-
221
-
222
-
223
-
224
-
225
-
226
-
227
-
228
-
229
-
230
-
231
-
232
-
233
-
234
-
235
-
236
-
237
-
238
-
239
-
240
-
241
-
242
-
243
-
244
-
245
-
246
-
247
-
248
-
249
-
250
-
251
-
252
-
253
 |
 |

16
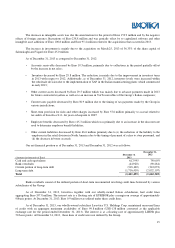
4. CAPITAL EXPENDITURES
Capital expenditures amounted to Euro 369.7 million in 2013
and Euro 372.9 million in 2012, analyzed as follows
(in millions of Euro):
Operating segment 2013
2012
Manufacturing and wholesale distribution 157.2
148.0
Retail distribution 212.5
224.9
Group total 369.7
372.9
Capital expenditures in the manufacturing and wholesale distribution segment were primarily in Italy (Euro 68.8
million in 2013 and Euro 59.4 million in 2012), in China (Euro 39.6 million in 2013 and Euro 33.1 million in 2012) and in
North America (Euro 37.1 million in 2013 and Euro 46.2 million in 2012). The overall increase in capital expenditures in
2013 as compared to 2012 is related to the routine technology upgrades to the manufacturing structure and to the continued
roll-out of an IT platform, which was originally introduced in 2009.
Capital expenditures in the retail distribution segment were primarily in North America (Euro 157.5 million in 2013
and Euro 173.4 million in 2012) and Australia and China (Euro 33.2 million in 2013 and Euro 35.1 million in 2012) and
related, for both 2013 and 2012, to the opening of new stores, the remodeling of older stores whose leases were extended
during the year, and to projects for upgrading the management information system.
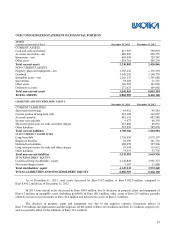
Intangible assets of Euro 4,306.4 million primarily reflect the Group's investment in goodwill and trademarks as a
result of acquisitions over the years.
Amortization recognized in the statement of consolidated income was Euro 366.6 million in 2013 as compared to
Euro 358.3 million in 2012.
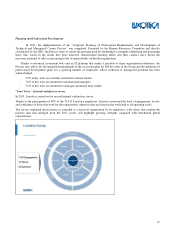
5. HUMAN RESOURCES
Group Headcount
As of December 31, 2013, Luxottica Group had 73,415 employees of which 64.0% were dedicated to the retail
segment, 10.7% were in the wholesale segment and 24.8% were in manufacturing activities and logistics. Central Corporate
services represent 0.5% of the Group's total workforce.
In terms of the geographic distribution, 57.8% of Luxottica's employees are in North America, 13.1% are in Europe,
21.3% are in Asia Pacific and 6.6% are in South America.
Business Area
No. Employees 2013
2013
Retail 46,966
64.0%
Wholesale 7,835
10.7%
Operations 18,215
24.8%
Corporate 399
0.5%
Total
73,415
100.00%
Geographic Area
No. Employees 2013
2013
Europe 9,600
13.1%
North America 42,455
57.8%
Asia- Pacific 15,623
21.3%
South America 4,814
6.6%
Middle East & Africa 524
0.7%
Corporate 399
0.5%
Total
73,415
100.00%