LensCrafters 2013 Annual Report Download - page 120
Download and view the complete annual report
Please find page 120 of the 2013 LensCrafters annual report below. You can navigate through the pages in the report by either clicking on the pages listed below, or by using the keyword search tool below to find specific information within the annual report.-
 1
1 -
2
-
3
-
4
-
5
-
6
-
7
-
8
-
9
-
10
-
11
-
12
-
13
-
14
-
15
-
16
-
17
-
18
-
19
-
20
-
21
-
22
-
23
-
24
-
25
-
26
-
27
-
28
-
29
-
30
-
31
-
32
-
33
-
34
-
35
-
36
-
37
-
38
-
39
-
40
-
41
-
42
-
43
-
44
-
45
-
46
-
47
-
48
-
49
-
50
-
51
-
52
-
53
-
54
-
55
-
56
-
57
-
58
-
59
-
60
-
61
-
62
-
63
-
64
-
65
-
66
-
67
-
68
-
69
-
70
-
71
-
72
-
73
-
74
-
75
-
76
-
77
-
78
-
79
-
80
-
81
-
82
-
83
-
84
-
85
-
86
-
87
-
88
-
89
-
90
-
91
-
92
-
93
-
94
-
95
-
96
-
97
-
98
-
99
-
100
-
101
-
102
-
103
-
104
-
105
-
106
-
107
-
108
-
109
-
 110
110 -
 111
111 -
 112
112 -
 113
113 -
 114
114 -
 115
115 -
 116
116 -
 117
117 -
 118
118 -
 119
119 -
 120
120 -
 121
121 -
 122
122 -
 123
123 -
 124
124 -
 125
125 -
 126
126 -
 127
127 -
 128
128 -
 129
129 -
 130
130 -
131
-
132
-
133
-
134
-
135
-
136
-
137
-
138
-
139
-
140
-
141
-
142
-
143
-
144
-
145
-
146
-
147
-
148
-
149
-
150
-
151
-
152
-
153
-
154
-
155
-
156
-
157
-
158
-
159
-
160
-
161
-
162
-
163
-
164
-
165
-
166
-
167
-
168
-
169
-
170
-
171
-
172
-
173
-
174
-
175
-
176
-
177
-
178
-
179
-
180
-
181
-
182
-
183
-
184
-
185
-
186
-
187
-
188
-
189
-
190
-
191
-
192
-
193
-
194
-
195
-
196
-
197
-
198
-
199
-
200
-
201
-
202
-
203
-
204
-
205
-
206
-
207
-
208
-
209
-
210
-
211
-
212
-
213
-
214
-
215
-
216
-
217
-
218
-
219
-
220
-
221
-
222
-
223
-
224
-
225
-
226
-
227
-
228
-
229
-
230
-
231
-
232
-
233
-
234
-
235
-
236
-
237
-
238
-
239
-
240
-
241
-
242
-
243
-
244
-
245
-
246
-
247
-
248
-
249
-
250
-
251
-
252
-
253
 |
 |

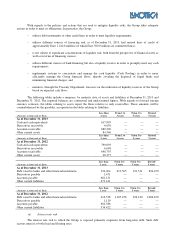
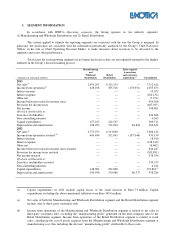
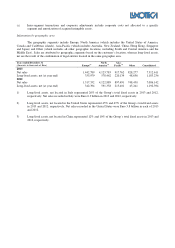
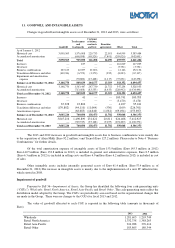
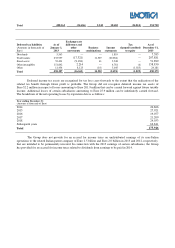
(c) Inter-segment transactions and corporate adjustments include corporate costs not allocated to a specific
segment and amortization of acquired intangible assets.
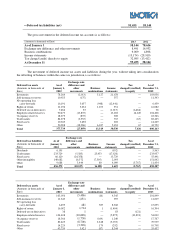
Information by geographic area
The geographic segments include Europe, North America (which includes the United States of America,
Canada and Caribbean islands), Asia-Pacific (which includes Australia, New Zealand, China, Hong Kong, Singapore
and Japan) and Other (which includes all other geographic locations, including South and Central America and the
Middle East). Sales are attributed to geographic segments based on the customer’s location, whereas long-lived assets,
net are the result of the combination of legal entities located in the same geographic area.
Years ended December 31
(Amounts in thousands of Euro)
Europe
(1)
North
America
(2)
Asia-
Pacific
(3)
Other
Consolidated
2013
Net sales 1,442,789
4,123,783
917,762
828,277
7,312,611
Long-lived assets, net (at year end) 335,979
578,462
220,139
48,656
1,183,236
2012
Net sales 1,317,332
4,122,889
897,491
748,430
7,086,142
Long-lived assets, net (at year end) 342,394
591,358
213,401
45,241
1,192,394
1) Long-lived assets, net located in Italy represented 26% of the Group’s total fixed assets in 2013 and 2012,
respectively. Net sales recorded in Italy were Euro 0.3 billion in 2013 and 2012, respectively.
2) Long-lived assets, net located in the United States represented 45% and 47% of the Group’s total fixed assets
in 2013 and 2012, respectively. Net sales recorded in the United States were Euro 3.8 billion in each of 2013
and 2012.
3) Long-lived assets, net located in China represented 12% and 10% of the Group’s total fixed assets in 2013 and
2012, respectively.