LensCrafters 2013 Annual Report Download - page 10
Download and view the complete annual report
Please find page 10 of the 2013 LensCrafters annual report below. You can navigate through the pages in the report by either clicking on the pages listed below, or by using the keyword search tool below to find specific information within the annual report.-
 1
1 -
 2
2 -
 3
3 -
 4
4 -
 5
5 -
 6
6 -
 7
7 -
 8
8 -
 9
9 -
 10
10 -
 11
11 -
 12
12 -
 13
13 -
 14
14 -
 15
15 -
 16
16 -
 17
17 -
 18
18 -
 19
19 -
 20
20 -
 21
21 -
22
-
23
-
24
-
25
-
26
-
27
-
28
-
29
-
30
-
31
-
32
-
33
-
34
-
35
-
36
-
37
-
38
-
39
-
40
-
41
-
42
-
43
-
44
-
45
-
46
-
47
-
48
-
49
-
50
-
51
-
52
-
53
-
54
-
55
-
56
-
57
-
58
-
59
-
60
-
61
-
62
-
63
-
64
-
65
-
66
-
67
-
68
-
69
-
70
-
71
-
72
-
73
-
74
-
75
-
76
-
77
-
78
-
79
-
80
-
81
-
82
-
83
-
84
-
85
-
86
-
87
-
88
-
89
-
90
-
91
-
92
-
93
-
94
-
95
-
96
-
97
-
98
-
99
-
100
-
101
-
102
-
103
-
104
-
105
-
106
-
107
-
108
-
109
-
110
-
111
-
112
-
113
-
114
-
115
-
116
-
117
-
118
-
119
-
120
-
121
-
122
-
123
-
124
-
125
-
126
-
127
-
128
-
129
-
130
-
131
-
132
-
133
-
134
-
135
-
136
-
137
-
138
-
139
-
140
-
141
-
142
-
143
-
144
-
145
-
146
-
147
-
148
-
149
-
150
-
151
-
152
-
153
-
154
-
155
-
156
-
157
-
158
-
159
-
160
-
161
-
162
-
163
-
164
-
165
-
166
-
167
-
168
-
169
-
170
-
171
-
172
-
173
-
174
-
175
-
176
-
177
-
178
-
179
-
180
-
181
-
182
-
183
-
184
-
185
-
186
-
187
-
188
-
189
-
190
-
191
-
192
-
193
-
194
-
195
-
196
-
197
-
198
-
199
-
200
-
201
-
202
-
203
-
204
-
205
-
206
-
207
-
208
-
209
-
210
-
211
-
212
-
213
-
214
-
215
-
216
-
217
-
218
-
219
-
220
-
221
-
222
-
223
-
224
-
225
-
226
-
227
-
228
-
229
-
230
-
231
-
232
-
233
-
234
-
235
-
236
-
237
-
238
-
239
-
240
-
241
-
242
-
243
-
244
-
245
-
246
-
247
-
248
-
249
-
250
-
251
-
252
-
253
 |
 |

5
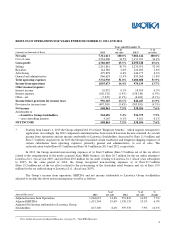
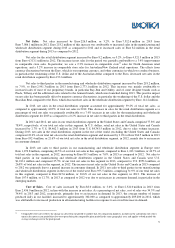
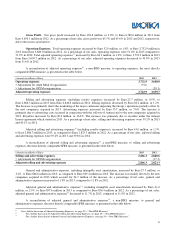
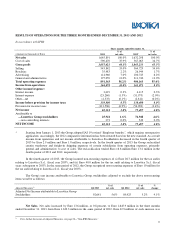
Net Sales. Net sales increased by Euro 226.5 million, or 3.2%, to Euro 7,312.6 million in 2013 from
Euro 7,086.1 million in 2012. Euro 218.2 million of this increase was attributable to increased sales in the manufacturing and
wholesale distribution segment during 2013 as compared to 2012 and to increased sales of Euro 8.2 million in the retail
distribution segment during 2013 as compared to 2012.
Net sales for the retail distribution segment increased by Euro 8.2 million, or 0.2%, to Euro 4,321.3 million in 2013
from Euro 4,313.1 million in 2012. The increase in net sales for the period was partially attributable to a 3.4% improvement
in comparable store sales. In particular, we saw a 2.3% increase in comparable store
10
sales for North American retail
operations, and a 5.2% increase in comparable store sales for Australian/New Zealand retail operations. The effects from
currency fluctuations between the Euro, which is our reporting currency, and other currencies in which we conduct business,
in particular the weakening of the U.S. dollar and of the Australian dollar compared to the Euro, decreased net sales in the
retail distribution segment by Euro 193.6 million.
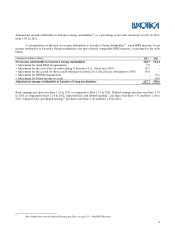
Net sales to third parties in the manufacturing and wholesale distribution segment increased by Euro 218.2 million,
or 7.9%, to Euro 2,991.3 million in 2013 from Euro 2,773.1 million in 2012. This increase was mainly attributable to
increased sales of most of our proprietary brands, in particular Ray-Ban and Oakley, and of some designer brands such as
Prada, Tiffany and the additional sales related to the Armani brands, which were launched during 2013. This positive impact
on net sales has been partially offset by negative currency fluctuations, in particular the weakening of the U.S. dollar and the
Brazilian Real compared to the Euro, which decreased net sales in the wholesale distribution segment by Euro 114.2 million.
In 2013, net sales in the retail distribution segment accounted for approximately 59.2% of total net sales, as
compared to approximately 60.9% of total net sales in 2012. This decrease in sales for the retail distribution segment as a
percentage of total net sales was primarily attributable to a 7.9% increase in net sales for the manufacturing and wholesale
distribution segment for 2013 as compared to a 0.2% increase in net sales to third parties in the retail distribution.
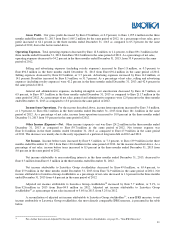
In 2013 and 2012, net sales in our retail distribution segment in the United States and Canada comprised 77.8% and
78.4%, respectively, of our total net sales in this segment. In U.S. dollars, retail net sales in the United States and Canada
increased by 2.7% to U.S. $4,462.3 million in 2013 from U.S. $4,343.5 million in 2012, due to sales volume increases.
During 2013, net sales in the retail distribution segment in the rest of the world (excluding the United States and Canada)
comprised 22.2% of our total net sales in the retail distribution segment and increased by 3.0% to Euro 960.5 million in 2013
from Euro 932.4 million, or 21.6% of our total net sales in the retail distribution segment, in 2012, mainly due to an increase
in consumer demand.
In 2013, net sales to third parties in our manufacturing and wholesale distribution segment in Europe were
Euro 1,272.8 million, comprising 42.5% of our total net sales in this segment, compared to Euro 1,183.3 million, or 42.7% of
total net sales in the segment, in 2012, increasing by Euro 89.5 million, or 7.6%, in 2013 as compared to 2012. Net sales to
third parties in our manufacturing and wholesale distribution segment in the United States and Canada were U.S.
$1,013.1 million and comprised 25.5% of our total net sales in this segment in 2013, compared to U.S. $953.6 million, or
26.8% of total net sales in the segment, in 2012. The increase in net sales in the United States and Canada in 2013 compared
to 2012 was primarily due to a general increase in consumer demand. In 2013, net sales to third parties in our manufacturing
and wholesale distribution segment in the rest of the world were Euro 955.5 million, comprising 31.9% of our total net sales
in this segment, compared to Euro 847.6 million, or 30.6% of our net sales in this segment, in 2012. The increase of
Euro 107.9 million, or 12.7%, in 2013 as compared to 2012 was due to an increase in consumer demand, in particular in the
emerging markets.
Cost of Sales. Cost of sales increased by Euro 88.0 million, or 3.6%, to Euro 2,524.0 million in 2013 from
Euro 2,436.0 million in 2012, in line with the increase in net sales. As a percentage of net sales, cost of sales was 34.5% and
34.4% in 2013 and 2012, respectively, primarily due to an increase in demand. In 2013, the average number of frames
produced daily in our facilities increased to approximately 302,000 as compared to approximately 289,200 in 2012, which
was attributable to increased production in all manufacturing facilities in response to an overall increase in demand.
10
Comparable store sales reflects the change in sales from one period to another that, for comparison purposes, includes in the calculation only stores
open in the more recent period that also were open during the comparable prior period in the same geographic area, and applies to both periods the
average exchange rate for the prior period.