LensCrafters 2013 Annual Report Download - page 162
Download and view the complete annual report
Please find page 162 of the 2013 LensCrafters annual report below. You can navigate through the pages in the report by either clicking on the pages listed below, or by using the keyword search tool below to find specific information within the annual report.-
 1
1 -
2
-
3
-
4
-
5
-
6
-
7
-
8
-
9
-
10
-
11
-
12
-
13
-
14
-
15
-
16
-
17
-
18
-
19
-
20
-
21
-
22
-
23
-
24
-
25
-
26
-
27
-
28
-
29
-
30
-
31
-
32
-
33
-
34
-
35
-
36
-
37
-
38
-
39
-
40
-
41
-
42
-
43
-
44
-
45
-
46
-
47
-
48
-
49
-
50
-
51
-
52
-
53
-
54
-
55
-
56
-
57
-
58
-
59
-
60
-
61
-
62
-
63
-
64
-
65
-
66
-
67
-
68
-
69
-
70
-
71
-
72
-
73
-
74
-
75
-
76
-
77
-
78
-
79
-
80
-
81
-
82
-
83
-
84
-
85
-
86
-
87
-
88
-
89
-
90
-
91
-
92
-
93
-
94
-
95
-
96
-
97
-
98
-
99
-
100
-
101
-
102
-
103
-
104
-
105
-
106
-
107
-
108
-
109
-
110
-
111
-
112
-
113
-
114
-
115
-
116
-
117
-
118
-
119
-
120
-
121
-
122
-
123
-
124
-
125
-
126
-
127
-
128
-
129
-
130
-
131
-
132
-
133
-
134
-
135
-
136
-
137
-
138
-
139
-
140
-
141
-
142
-
143
-
144
-
145
-
146
-
147
-
148
-
149
-
150
-
151
-
 152
152 -
 153
153 -
 154
154 -
 155
155 -
 156
156 -
 157
157 -
 158
158 -
 159
159 -
 160
160 -
 161
161 -
 162
162 -
 163
163 -
 164
164 -
 165
165 -
 166
166 -
 167
167 -
 168
168 -
 169
169 -
 170
170 -
 171
171 -
 172
172 -
173
-
174
-
175
-
176
-
177
-
178
-
179
-
180
-
181
-
182
-
183
-
184
-
185
-
186
-
187
-
188
-
189
-
190
-
191
-
192
-
193
-
194
-
195
-
196
-
197
-
198
-
199
-
200
-
201
-
202
-
203
-
204
-
205
-
206
-
207
-
208
-
209
-
210
-
211
-
212
-
213
-
214
-
215
-
216
-
217
-
218
-
219
-
220
-
221
-
222
-
223
-
224
-
225
-
226
-
227
-
228
-
229
-
230
-
231
-
232
-
233
-
234
-
235
-
236
-
237
-
238
-
239
-
240
-
241
-
242
-
243
-
244
-
245
-
246
-
247
-
248
-
249
-
250
-
251
-
252
-
253
 |
 |

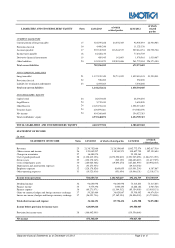
Separate financial Statements as of December 31,2013 Page 2 of 6
LIABILITIES AND STOCKHOLDERS’ EQUITY Notes
12/31/2013 of which
related parties 12/31/2012
of which
related
parties
CURRENT LIABILITIES
Current portion of long-term debt 15 324,079,228
24,078,305
92,905,093
22,904,983
Provisions for risk 16 4,468,246
11,325,338
Accounts payable 17 292,330,580
116,244,357
229,661,151
130,798,704
Income taxes payable 18 18,426,150
77,634,705
Derivative financial instruments 19 489,945
141,643
1,976,561
1,030,467
Other liabilities 20 145,501,870
102,803,686
261,770,834
226,373,180
Total current liabilities 785,296,019
675,273,682
NON-CURRENT LIABILITIES
Long-term debt 21 1,137,199,349
28,731,902
1,452,418,145
51,290,031
Provisions for risk 22 558,000
550,000
Liability for termination indemnities 23 6,495,263
5,536,460
Total non-current liabilities 1,144,252,612
1,458,504,605
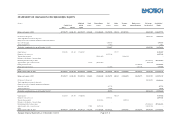
STOCKHOLDERS’ EQUITY
Capital stock 24 28,653,640
28,394,292
Legal Reseve 24 5,712,410
5,624,808
Other Reserve 24 2,129,976,013
1,958,591,287
Treasury shares 24 (83,059,861)
(91,928,455)
Net income 24 454,366,669
354,027,383
Total stockholders’ equity 2,535,648,871
2,254,709,315
TOTAL LIABILITIES AND STOCKHOLDERS’ EQUITY
4,465,197,502
4,388,487,602
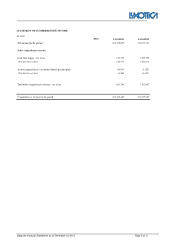
STATEMENT OF INCOME
(in euro)
STATEMENT OF INCOME Notes
12/31/2013 of which related parties
12/31/2012 of which
related parties
Revenues 25 2,138,752,866
2,126,354,865
1,892,772,574
1,842,617,516
Other revenue and income 26 120,040,207
118,510,571
108,627,790
107,199,694
Changes in inventories 27 16,489,074
25,150,163
Cost of goods purchased 28 (1,128,619,126)
(1,070,550,819)
(1,051,905,655)
(1,044,713,055)
Service costs 29 (190,178,345)
(549,329)
(160,486,619)
(11,417,395)
Costs of third-party assets 30 (180,025,368)
(19,695,270)
(147,861,997)
(20,956,435)
Depreciation and amortization expenses 31 (53,273,533)
(49,316,332)
Employee expenses 32 (128,178,826)
8,809,655
(113,901,254)
6,387,867
Other operating expenses 33 (10,323,436)
(951,454)
(10,946,131)
(2,358,173)
Income from operations 584,683,513
1,161,928,219
492,132,539
876,760,019
Dividend income 34 96,630,998
96,630,998
73,415,833
73,415,833
Finance income 35 5,575,396
3,000,455
12,488,182
4,963,726
Finance expense 36 (69,271,971)
(11,344,512)
(85,354,905)
(13,005,151)
Gains on currency hedges and foreign currency exchange 37 59,283,464
36,629,847
55,708,992
44,474,514
Losses on currency hedges and foreign currency exchange 37 (56,091,736)
(37,162,354)
(54,806,594)
(33,774,840)
Total other income and expense 36,126,151
87,754,434
1,451,508
76,074,082
Income before provision for income taxes 620,809,664
493,584,047
Provision for income taxes 38 (166,442,995)
(139,556,664)
Net income 454,366,669
354,027,383