LensCrafters 2013 Annual Report Download - page 16
Download and view the complete annual report
Please find page 16 of the 2013 LensCrafters annual report below. You can navigate through the pages in the report by either clicking on the pages listed below, or by using the keyword search tool below to find specific information within the annual report.
11
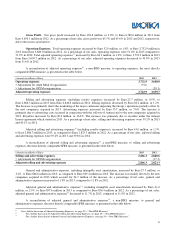
Gross Profit. Our gross profit decreased by Euro 9.8 million, or 0.9 percent, to Euro 1,055.4 million in the three
months ended December 31, 2013 from Euro 1,065.2 million for the same period of 2012. As a percentage of net sales, gross
profit increased to 64.1 percent in the three months ended December 31, 2013 as compared to 65.3 percent for the same
period of 2012, due to the factors noted above.
Operating Expenses. Total operating expenses decreased by Euro 12.8 million, or 1.4 percent, to Euro 891.3 million in the
three months ended December 31, 2013 from Euro 904.2 million in the same period of 2012. As a percentage of net sales,
operating expenses decreased to 54.2 percent in the three months ended December 31, 2013, from 55.4 percent in the same
period of 2012.
Selling and advertising expenses (including royalty expenses) increased by Euro 1.8 million, or 0.3 percent, to
Euro 694.3 million in the three months ended December 31, 2013 from Euro 692.4 million in the same period of 2012.
Selling expenses decreased by Euro 20.9 million, or 3.7 percent. Advertising expenses increased by Euro 14.2 million, or
14.1 percent. Royalties increased by Euro 8.5 million, or 31.7 percent. As a percentage of net sales, selling and advertising
expenses (including royalty expenses) were 42.2 percent in the three months ended December 31, 2013 and 42.4 percent in
the same period of 2012.
General and administrative expenses, including intangible asset amortization decreased by Euro 14.7 million, or
6.9 percent, to Euro 197.1 million in the three months ended December 31, 2013 as compared to Euro 211.7 million in the
same period of 2012. As a percentage of net sales, general and administrative expenses were 12.0 percent in the three months
ended December 31, 2013 as compared to 13.0 percent in the same period of 2012.
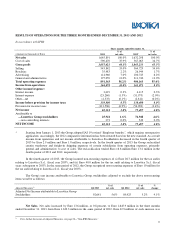
Income from Operations. For the reasons described above, income from operations increased by Euro 3.0 million,
or 1.9 percent, to Euro 164.1 million in the three months ended December 31, 2013 from Euro 161.1 million in the same
period of 2012. As a percentage of net sales, income from operations increased to 10.0 percent in the three months ended
December 31, 2013 from 9.9 percent in the same period of 2012.
Other Income (Expense)—Net. Other income (expense)—net was Euro (24.2) million in the three months ended
December 31, 2013 as compared to Euro (30.7) million in the same period of 2012. Net interest expense was
Euro 21.8 million in the three months ended December 31, 2013 as compared to Euro 27.9 million in the same period
of 2012. The decrease was mainly due to the early repayment of a portion of long term debt in 2012 and 2013.
Net Income. Income before taxes increased by Euro 9.5 million, or 7.3 percent, to Euro 139.9 million in the three
months ended December 31, 2013 from Euro 130.4 million in the same period of 2012, for the reasons described above. As a
percentage of net sales, income before taxes increased to 8.5 percent in the three months ended December 31, 2013 from
8.0 percent in the same period of 2012.
Net income attributable to non-controlling interests in the three months ended December 31, 2013, decreased to
Euro 0.3 million from Euro 0.5 million in the three months ended December 31, 2012.
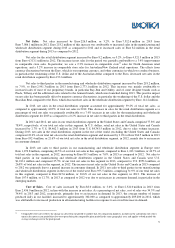
Net income attributable to Luxottica Group stockholders decreased by Euro 49.0 million, or 65.4 percent, to
Euro 25.9 million in the three months ended December 31, 2013 from Euro 74.9 million in the same period of 2012. Net
income attributable to Luxottica Group stockholders as a percentage of net sales decreased to 1.6 percent in the three months
ended December 31, 2013 from 4.6 percent in the same period of 2012.
Adjusted net income attributable to Luxottica Group stockholders
20
increased by Euro 7.7 million, or 9.1%, to
Euro 92.6 million in 2013 from Euro 84.9 million in 2012. Adjusted net income attributable to Luxottica Group
stockholders
20
as a percentage of net sales increased to 5.6% in 2013, from 5.2% in 2012.
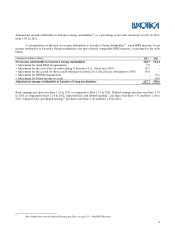
A reconciliation of adjusted net income attributable to Luxottica Group stockholders
20
, a non-IFRS measure, to net
income attributable to Luxottica Group stockholders, the most directly comparable IFRS measure, is presented in the table
below.
20
For a further discussion of Adjusted Net Income Attributable to Luxottica Stockholders, see page 29—“Non-IFRS Measures”.


