LensCrafters 2013 Annual Report Download - page 128
Download and view the complete annual report
Please find page 128 of the 2013 LensCrafters annual report below. You can navigate through the pages in the report by either clicking on the pages listed below, or by using the keyword search tool below to find specific information within the annual report.-
 1
1 -
2
-
3
-
4
-
5
-
6
-
7
-
8
-
9
-
10
-
11
-
12
-
13
-
14
-
15
-
16
-
17
-
18
-
19
-
20
-
21
-
22
-
23
-
24
-
25
-
26
-
27
-
28
-
29
-
30
-
31
-
32
-
33
-
34
-
35
-
36
-
37
-
38
-
39
-
40
-
41
-
42
-
43
-
44
-
45
-
46
-
47
-
48
-
49
-
50
-
51
-
52
-
53
-
54
-
55
-
56
-
57
-
58
-
59
-
60
-
61
-
62
-
63
-
64
-
65
-
66
-
67
-
68
-
69
-
70
-
71
-
72
-
73
-
74
-
75
-
76
-
77
-
78
-
79
-
80
-
81
-
82
-
83
-
84
-
85
-
86
-
87
-
88
-
89
-
90
-
91
-
92
-
93
-
94
-
95
-
96
-
97
-
98
-
99
-
100
-
101
-
102
-
103
-
104
-
105
-
106
-
107
-
108
-
109
-
110
-
111
-
112
-
113
-
114
-
115
-
116
-
117
-
 118
118 -
 119
119 -
 120
120 -
 121
121 -
 122
122 -
 123
123 -
 124
124 -
 125
125 -
 126
126 -
 127
127 -
 128
128 -
 129
129 -
 130
130 -
 131
131 -
 132
132 -
 133
133 -
 134
134 -
 135
135 -
 136
136 -
 137
137 -
 138
138 -
139
-
140
-
141
-
142
-
143
-
144
-
145
-
146
-
147
-
148
-
149
-
150
-
151
-
152
-
153
-
154
-
155
-
156
-
157
-
158
-
159
-
160
-
161
-
162
-
163
-
164
-
165
-
166
-
167
-
168
-
169
-
170
-
171
-
172
-
173
-
174
-
175
-
176
-
177
-
178
-
179
-
180
-
181
-
182
-
183
-
184
-
185
-
186
-
187
-
188
-
189
-
190
-
191
-
192
-
193
-
194
-
195
-
196
-
197
-
198
-
199
-
200
-
201
-
202
-
203
-
204
-
205
-
206
-
207
-
208
-
209
-
210
-
211
-
212
-
213
-
214
-
215
-
216
-
217
-
218
-
219
-
220
-
221
-
222
-
223
-
224
-
225
-
226
-
227
-
228
-
229
-
230
-
231
-
232
-
233
-
234
-
235
-
236
-
237
-
238
-
239
-
240
-
241
-
242
-
243
-
244
-
245
-
246
-
247
-
248
-
249
-
250
-
251
-
252
-
253
 |
 |

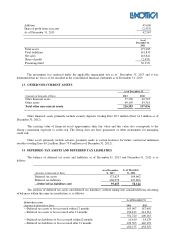
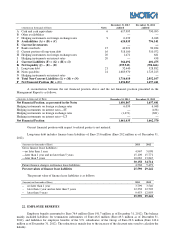
—Deferred tax liabilities (net) 95,455
58,144
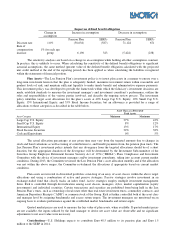
The gross movement in the deferred income tax accounts is as follows:
(Amounts in thousands of Euro)
2013 2012
As of January 1
58,144
78,636
Exchange rate difference and other movements 8,491
16,932
Business combinations 9,009
4,898
Income statements (13,174)
(28,910)
Tax charge/(credit) directly to equity 32,985
(13,412)
At December 31 95,455
58,144
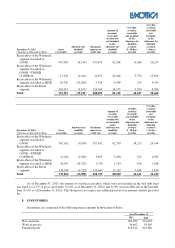
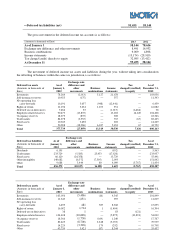
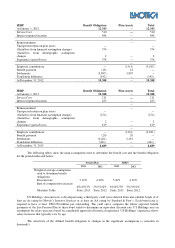
The movement of deferred income tax assets and liabilities during the year, without taking into consideration
the offsetting of balances within the same tax jurisdiction, is as follows:
Deferred tax assets
(Amounts in thousands of
Euro)
As of
January 1,
2012
Exchange rate
difference and
other
movements
Business
combinations
Income
statements
Tax
charged/(credited)
to equity
As of
December 31,
2012
Inventories 78,264
(2,013)
5,127
21,678
—
103,056
Self-insurance reserves 10,923
(137)
—
557
—
11,343
Net operating loss
carry-forwards 16,191
3,657
(948)
(12,441)
—
6,459
Rights of return 11,194
3,234
1,103
551
—
16,082
Deferred tax on derivatives 7,484
55
—
(1,017)
(6,484)
38
Employee-related reserves 90,473
(13,837)
—
13,652
14,120
104,408
Occupancy reserves 18,275
(837)
—
928
—
18,366
Trade names 84,278
(2,553)
—
767
(67)
82,425
Fixed assets 10,369
3,658
—
202
—
14,229
Other 50,288
(18,286)
6,037
5,653
67
43,759
Total 377,739
(27,059)
11,319
30,530
7,636
400,163
Deferred tax liabilities
(Amounts in thousands of
Euro)
As of
January 1,
2012
Exchange rate
difference and
other
movements
Business
combinations
Income
statements
Tax
charged/(credited)
to equity
As of
December 31,
2012
Dividends 6,155
—
—
(592)
—
5,563
Trade names 233,729
(5,585)
23,433
(17,620)
—
233,957
Fixed assets 66,120
(24,358)
—
13,729
—
55,491
Other intangibles 140,682
16,372
(7,305)
2,093
—
151,842
Other 9,688
3,444
80
4,009
(5,767)
11,454
Total 456,375
(10,127)
16,208
1,619
(5,767)
458,307
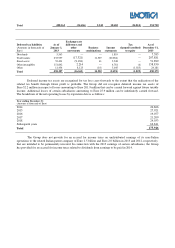
Deferred tax assets
(Amounts in thousands of
Euro)
As of
January 1,
2013
Exchange rate
difference and
other
movements
Business
combinations
Income
statements
Tax
charged/(credited)
to equity
As of
December 31,
2013
Inventories 103,056
(5,486)
(16)
4,345
—
101,899
Self-insurance reserves 11,343
(431)
-
907
—
11,819
Net operating loss
carry-forwards 6,459
481
387
8,368
—
15,695
Rights of return 16,082
1,714
1
(1,404)
—
16,394
Deferred tax on derivatives 38
1
—
83
(121)
—-
Employee-related reserves 104,408
(10,608)
—
(5,875)
(33,893)
54,032
Occupancy reserves 18,366
(1,730)
(169)
1,240
—
17,707
Trade names 82,425
(8,700)
2,248
(5,033)
—
70,939
Fixed assets 14,229
(3,318)
179
(292)
—
10,798
Other 43,759
3,421
(87)
8,344
—
55,437