LensCrafters 2013 Annual Report Download - page 125
Download and view the complete annual report
Please find page 125 of the 2013 LensCrafters annual report below. You can navigate through the pages in the report by either clicking on the pages listed below, or by using the keyword search tool below to find specific information within the annual report.-
 1
1 -
2
-
3
-
4
-
5
-
6
-
7
-
8
-
9
-
10
-
11
-
12
-
13
-
14
-
15
-
16
-
17
-
18
-
19
-
20
-
21
-
22
-
23
-
24
-
25
-
26
-
27
-
28
-
29
-
30
-
31
-
32
-
33
-
34
-
35
-
36
-
37
-
38
-
39
-
40
-
41
-
42
-
43
-
44
-
45
-
46
-
47
-
48
-
49
-
50
-
51
-
52
-
53
-
54
-
55
-
56
-
57
-
58
-
59
-
60
-
61
-
62
-
63
-
64
-
65
-
66
-
67
-
68
-
69
-
70
-
71
-
72
-
73
-
74
-
75
-
76
-
77
-
78
-
79
-
80
-
81
-
82
-
83
-
84
-
85
-
86
-
87
-
88
-
89
-
90
-
91
-
92
-
93
-
94
-
95
-
96
-
97
-
98
-
99
-
100
-
101
-
102
-
103
-
104
-
105
-
106
-
107
-
108
-
109
-
110
-
111
-
112
-
113
-
114
-
 115
115 -
 116
116 -
 117
117 -
 118
118 -
 119
119 -
 120
120 -
 121
121 -
 122
122 -
 123
123 -
 124
124 -
 125
125 -
 126
126 -
 127
127 -
 128
128 -
 129
129 -
 130
130 -
 131
131 -
 132
132 -
 133
133 -
 134
134 -
 135
135 -
136
-
137
-
138
-
139
-
140
-
141
-
142
-
143
-
144
-
145
-
146
-
147
-
148
-
149
-
150
-
151
-
152
-
153
-
154
-
155
-
156
-
157
-
158
-
159
-
160
-
161
-
162
-
163
-
164
-
165
-
166
-
167
-
168
-
169
-
170
-
171
-
172
-
173
-
174
-
175
-
176
-
177
-
178
-
179
-
180
-
181
-
182
-
183
-
184
-
185
-
186
-
187
-
188
-
189
-
190
-
191
-
192
-
193
-
194
-
195
-
196
-
197
-
198
-
199
-
200
-
201
-
202
-
203
-
204
-
205
-
206
-
207
-
208
-
209
-
210
-
211
-
212
-
213
-
214
-
215
-
216
-
217
-
218
-
219
-
220
-
221
-
222
-
223
-
224
-
225
-
226
-
227
-
228
-
229
-
230
-
231
-
232
-
233
-
234
-
235
-
236
-
237
-
238
-
239
-
240
-
241
-
242
-
243
-
244
-
245
-
246
-
247
-
248
-
249
-
250
-
251
-
252
-
253
 |
 |
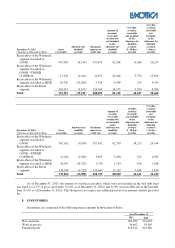
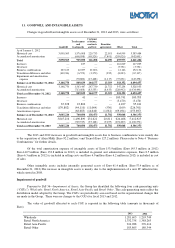
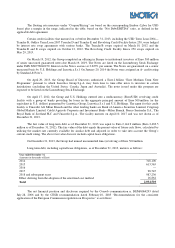
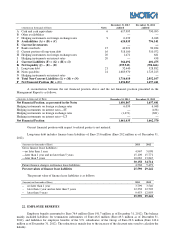
11. GOODWILL AND INTANGIBLE ASSETS
Changes in goodwill and intangible assets as of December 31, 2012 and 2013, were as follows:
Goodwill
Trade names
and
trademarks
Customer
relations,
contracts
and lists
Franchise
agreements
Other
Total
As of January 1, 2012
Historical cost 3,090,563
1,576,008
229,733
22,181
464,999
5,383,484
Accumulated amortization
(660,958)
(68,526)
(7,491)
(205,026)
(942,001)
Total 3,090,563
915,050
161,208
14,690
259,973
4,441,484
Increases —
187
—
—
116,819
117,005
Decreases —
—
—
—
(3,751)
(3,751)
Business combinations 107,123
12,057
21,806
—
11,146
152,132
Translation difference and other (48,916)
(6,572)
(3,370)
(255)
(8,003)
(67,117)
Impairment and amortization
expense —
(70,882)
(15,468)
(1,117)
(57,831)
(145,298)
Balance as of December 31, 2012 3,148,770
849,839
164,177
13,319
318,352
4,494,457
Historical cost 3,148,770
1,563,447
247,730
21,752
547,254
5,528,953
Accumulated amortization
(713,608)
(83,553)
(8,433)
(228,902)
(1,034,496)
Total as of December 31, 2012 3,148,770
849,839
164,177
13,319
318,352
4,494,457
Increases —
41
—
—
100,741
100,783
Decreases —
—
—
—
(3,470)
(3,470)
Business combinations
67,328
23,806
—
—
4,107
95,241
Translation difference and other
(170,882)
(44,110)
(11,064)
(536)
(169)
(226,761)
Amortization expense
-
(68,683)
(14,640)
(1,081)
(69,494)
(153,897)
Balance as of December 31, 2013 3,045,216
760,894
138,473
11,702
350,068
4,306,353
Historical cost
3,045,216
1,490,809
231,621
20,811
624,468
5,412,925
Accumulated amortization —
(729,915)
(93,148)
(9,109)
(274,400)
(1,106,572)
Total as of December 31, 2013 3,045,216
760,894
138,473
11,702
350,068
4,306,353
The 2013 and 2012 increases in goodwill and intangible assets due to business combinations were mainly due
to the acquisition of Alain Mikli (Euro 92.2 million ) and Tecnol (Euro 127.2 million). Please refer to Note 4 “Business
Combinations” for further details.
Of the total amortization expense of intangible assets of Euro 153.9 million (Euro 145.3 million in 2012)
Euro 140.5 million (Euro 132.8 million in 2012) is included in general and administrative expenses, Euro 8.5 million
(Euro 6.3 million in 2012) is included in selling costs and Euro 4.9 million (Euro 6.2 million in 2012) is included in cost
of sales.
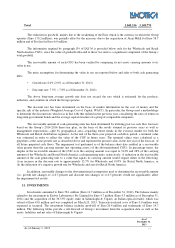
Other intangible assets includes internally generated assets of Euro 61.4 million (Euro 57.4 million as of
December 31, 2012).The increase in intangible assets is mainly due to the implementation of a new IT infrastructure,
which started in 2008.
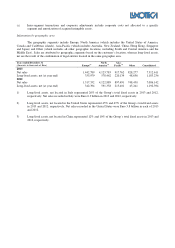
Impairment of goodwill
Pursuant to IAS 36—Impairment of Assets, the Group has identified the following four cash-generating units
(“CGUs”): Wholesale, Retail North America, Retail Asia-Pacific and Retail Other. The cash-generating units reflect the
distribution model adopted by the Group. The CGUs are periodically assessed based on the organizational changes that
are made in the Group. There were no changes to the CGUs for fiscal 2013 and 2012.
The value of goodwill allocated to each CGU is reported in the following table (amounts in thousands of
Euro):
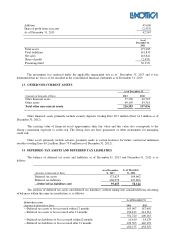
2013 2012
Wholesale 1,201,605
1,203,749
Retail North America 1,332,758
1,388,263
Retail Asia-Pacific 324,988
376,414
Retail Other 185,865
180,344