LensCrafters 2013 Annual Report Download - page 146
Download and view the complete annual report
Please find page 146 of the 2013 LensCrafters annual report below. You can navigate through the pages in the report by either clicking on the pages listed below, or by using the keyword search tool below to find specific information within the annual report.-
 1
1 -
2
-
3
-
4
-
5
-
6
-
7
-
8
-
9
-
10
-
11
-
12
-
13
-
14
-
15
-
16
-
17
-
18
-
19
-
20
-
21
-
22
-
23
-
24
-
25
-
26
-
27
-
28
-
29
-
30
-
31
-
32
-
33
-
34
-
35
-
36
-
37
-
38
-
39
-
40
-
41
-
42
-
43
-
44
-
45
-
46
-
47
-
48
-
49
-
50
-
51
-
52
-
53
-
54
-
55
-
56
-
57
-
58
-
59
-
60
-
61
-
62
-
63
-
64
-
65
-
66
-
67
-
68
-
69
-
70
-
71
-
72
-
73
-
74
-
75
-
76
-
77
-
78
-
79
-
80
-
81
-
82
-
83
-
84
-
85
-
86
-
87
-
88
-
89
-
90
-
91
-
92
-
93
-
94
-
95
-
96
-
97
-
98
-
99
-
100
-
101
-
102
-
103
-
104
-
105
-
106
-
107
-
108
-
109
-
110
-
111
-
112
-
113
-
114
-
115
-
116
-
117
-
118
-
119
-
120
-
121
-
122
-
123
-
124
-
125
-
126
-
127
-
128
-
129
-
130
-
131
-
132
-
133
-
134
-
135
-
 136
136 -
 137
137 -
 138
138 -
 139
139 -
 140
140 -
 141
141 -
 142
142 -
 143
143 -
 144
144 -
 145
145 -
 146
146 -
 147
147 -
 148
148 -
 149
149 -
 150
150 -
 151
151 -
 152
152 -
 153
153 -
 154
154 -
 155
155 -
 156
156 -
157
-
158
-
159
-
160
-
161
-
162
-
163
-
164
-
165
-
166
-
167
-
168
-
169
-
170
-
171
-
172
-
173
-
174
-
175
-
176
-
177
-
178
-
179
-
180
-
181
-
182
-
183
-
184
-
185
-
186
-
187
-
188
-
189
-
190
-
191
-
192
-
193
-
194
-
195
-
196
-
197
-
198
-
199
-
200
-
201
-
202
-
203
-
204
-
205
-
206
-
207
-
208
-
209
-
210
-
211
-
212
-
213
-
214
-
215
-
216
-
217
-
218
-
219
-
220
-
221
-
222
-
223
-
224
-
225
-
226
-
227
-
228
-
229
-
230
-
231
-
232
-
233
-
234
-
235
-
236
-
237
-
238
-
239
-
240
-
241
-
242
-
243
-
244
-
245
-
246
-
247
-
248
-
249
-
250
-
251
-
252
-
253
 |
 |

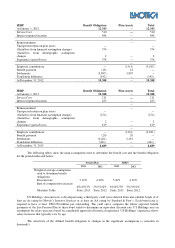
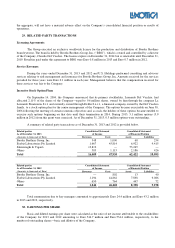
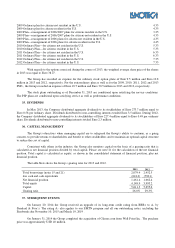
Basic earnings per share in 2013 were equal to Euro 1.15, compared to Euro 1.15 in 2012. Diluted earnings per
share in 2013 were equal to Euro 1.14 compared to Euro 1.14 in 2012.
The table reported below provides the reconciliation between the average weighted number of shares utilized
to calculate basic and diluted earnings per share:
2013 2012
Weighted average shares outstanding—basic 472,057,274
464,643,093
Effect of dilutive stock options 4,215,291
4,930,749
Weighted average shares outstanding—dilutive 476,272,565
469,573,841
Options not included in calculation of dilutive shares as the
average value was greater than the average price during the
respective period or performance measures related to the
awards have not yet been met
1,768,735
3,058,754
31. ATYPICAL AND/OR UNUSUAL OPERATIONS
There were no atypical and/or unusual transactions, as defined by the Consob communication n. 60644293 dated
July 28, 2006, that occurred in 2013 and 2012.
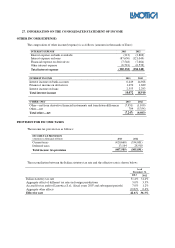
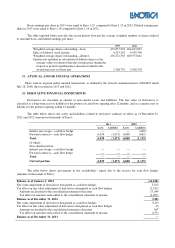
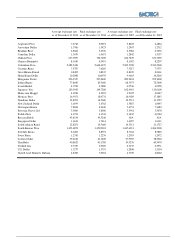
32. DERIVATIVE FINANCIAL INSTRUMENTS
Derivatives are classified as current or non-current assets and liabilities. The fair value of derivatives is
classified as a long-term asset or liability for the portion of cash flows expiring after 12 months, and as a current asset or
liability for the portion expiring within 12 months.
The table below shows the assets and liabilities related to derivative contracts in effect as of December 31,
2013 and 2012 (amounts in thousands of Euro):
2013
2012
Assets
Liabilities
Assets
Liabilities
Interest rate swaps—cash flow hedge —
—
—
(438)
Forward contracts—cash flow hedge 6,039
(1,471)
6,048
(681)
Total 6,039
(1,471)
6,048
(1,119)
of which:
Non-current portion
Interest rate swaps—cash flow hedge —
—
—
—
Forward contracts—cash flow hedge —
—
—
—
Total —
—
—
—
Current portion 6,039
(1,471)
6,048
(1,119)
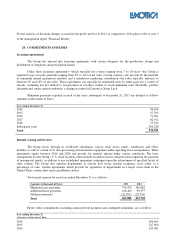
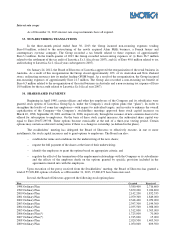
The table below shows movements in the stockholders’ equity due to the reserve for cash flow hedges
(amounts in thousands of Euro):
Balance as of January 1, 2012 (14,018)
Fair value adjustment of derivatives designated as cash flow hedges 3,163
Tax effect on fair value adjustment of derivatives designated as cash flow hedges (2,512)
Amounts reclassified to the consolidated statement of income 17,044
Tax effect on amounts reclassified to the consolidated statement of income (3,995)
Balance as of December 31, 2012 (318)
Fair value adjustment of derivatives designated as cash flow hedges (129)
Tax effect on fair value adjustment of derivatives designated as cash flow hedges 35
Amounts reclassified to the consolidated statement of income 567
Tax effect on amounts reclassified to the consolidated statement of income (155)
Balance as of December 31, 2013 —