LensCrafters 2013 Annual Report Download - page 116
Download and view the complete annual report
Please find page 116 of the 2013 LensCrafters annual report below. You can navigate through the pages in the report by either clicking on the pages listed below, or by using the keyword search tool below to find specific information within the annual report.-
 1
1 -
2
-
3
-
4
-
5
-
6
-
7
-
8
-
9
-
10
-
11
-
12
-
13
-
14
-
15
-
16
-
17
-
18
-
19
-
20
-
21
-
22
-
23
-
24
-
25
-
26
-
27
-
28
-
29
-
30
-
31
-
32
-
33
-
34
-
35
-
36
-
37
-
38
-
39
-
40
-
41
-
42
-
43
-
44
-
45
-
46
-
47
-
48
-
49
-
50
-
51
-
52
-
53
-
54
-
55
-
56
-
57
-
58
-
59
-
60
-
61
-
62
-
63
-
64
-
65
-
66
-
67
-
68
-
69
-
70
-
71
-
72
-
73
-
74
-
75
-
76
-
77
-
78
-
79
-
80
-
81
-
82
-
83
-
84
-
85
-
86
-
87
-
88
-
89
-
90
-
91
-
92
-
93
-
94
-
95
-
96
-
97
-
98
-
99
-
100
-
101
-
102
-
103
-
104
-
105
-
 106
106 -
 107
107 -
 108
108 -
 109
109 -
 110
110 -
 111
111 -
 112
112 -
 113
113 -
 114
114 -
 115
115 -
 116
116 -
 117
117 -
 118
118 -
 119
119 -
 120
120 -
 121
121 -
 122
122 -
 123
123 -
 124
124 -
 125
125 -
 126
126 -
127
-
128
-
129
-
130
-
131
-
132
-
133
-
134
-
135
-
136
-
137
-
138
-
139
-
140
-
141
-
142
-
143
-
144
-
145
-
146
-
147
-
148
-
149
-
150
-
151
-
152
-
153
-
154
-
155
-
156
-
157
-
158
-
159
-
160
-
161
-
162
-
163
-
164
-
165
-
166
-
167
-
168
-
169
-
170
-
171
-
172
-
173
-
174
-
175
-
176
-
177
-
178
-
179
-
180
-
181
-
182
-
183
-
184
-
185
-
186
-
187
-
188
-
189
-
190
-
191
-
192
-
193
-
194
-
195
-
196
-
197
-
198
-
199
-
200
-
201
-
202
-
203
-
204
-
205
-
206
-
207
-
208
-
209
-
210
-
211
-
212
-
213
-
214
-
215
-
216
-
217
-
218
-
219
-
220
-
221
-
222
-
223
-
224
-
225
-
226
-
227
-
228
-
229
-
230
-
231
-
232
-
233
-
234
-
235
-
236
-
237
-
238
-
239
-
240
-
241
-
242
-
243
-
244
-
245
-
246
-
247
-
248
-
249
-
250
-
251
-
252
-
253
 |
 |
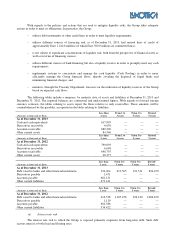
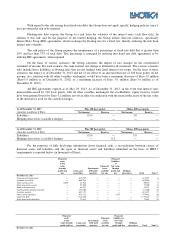
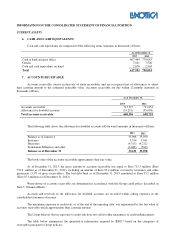
Cash and cash equivalents — 790,093 — — — — 790,093 6
Accounts receivable — 698,755 — — — — 698,755 7
Other current assets 6,048 48,377 — — — — 54,425 9
Other non-current assets — 62,718 — — — — 62,718 13
Short-term borrowings — 90,284 — — — — 90.284 15
Current portion of long-term debt — 310,072 — — — — 310,072 16
Accounts payable — 682,588 — — — — 682,588 17
Other current liabilities — 534,422 — — 681 438 535,541 20
Long-term debt — 2,052,107 — — — — 2,052,107 21
Other non-current liabilities — 52,702 — — — — 52,702 24
* The numbers reported above refer to the paragraphs within these notes to the consolidated financial statements
in which the financial assets and liabilities are further explained.
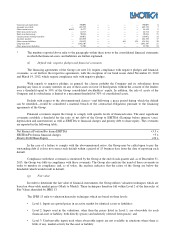
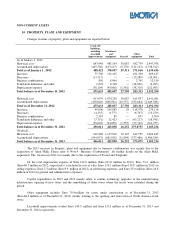
(f) Default risk: negative pledges and financial covenants
The financing agreements of the Group (see note 21) require compliance with negative pledges and financial
covenants, as set forth in the respective agreements, with the exception of our bond issues dated November 10, 2010
and March 19, 2012, which require compliance only with negative pledges.
With regards to negative pledges, in general, the clauses prohibit the Company and its subsidiaries from
granting any liens or security interests on any of their assets in favor of third parties without the consent of the lenders
over a threshold equal to 30% of the Group consolidated stockholders’ equity. In addition, the sale of assets of the
Company and its subsidiaries is limited to a maximum threshold of 30% of consolidated assets.
Default with respect to the abovementioned clauses—and following a grace period during which the default
can be remedied—would be considered a material breach of the contractual obligations pursuant to the financing
agreements of the Group.
Financial covenants require the Group to comply with specific levels of financial ratios. The most significant
covenants establish a threshold for the ratio of net debt of the Group to EBITDA (Earnings before interest, taxes,
depreciation and amortization) as well as EBITDA to financial charges and priority debt to share equity. The covenants
are reported in the following table:
Net Financial Position/Pro forma EBITDA <3.5 x
EBITDA/Pro forma financial charges >5 x
Priority Debt/Share Equity <20 x
In the case of a failure to comply with the abovementioned ratios, the Group may be called upon to pay the
outstanding debt if it does not correct such default within a period of 15 business days from the date of reporting such
default.
Compliance with these covenants is monitored by the Group at the end of each quarter and, as of December 31,
2013, the Group was fully in compliance with these covenants. The Group also analyzes the trend of these covenants in
order to monitor its compliance and, as of today, the analysis indicates that the ratios of the Group are below the
thresholds which would result in default.
(g) Fair value
In order to determine the fair value of financial instruments, the Group utilizes valuation techniques which are
based on observable market prices (Mark to Model). These techniques therefore fall within Level 2 of the hierarchy of
Fair Values identified by IFRS 13.
The IFRS 13 refer to valuation hierarchy techniques which are based on three levels:
• Level 1: Inputs are quoted prices in an active market for identical assets or liabilities;
• Level 2: Inputs used in the valuations, other than the prices listed in Level 1, are observable for each
financial asset or liability, both directly (prices) and indirectly (derived from prices); and
• Level 3: Unobservable inputs used when observable inputs are not available in situations where there is
little, if any, market activity for the asset or liability.