LensCrafters 2013 Annual Report Download - page 17
Download and view the complete annual report
Please find page 17 of the 2013 LensCrafters annual report below. You can navigate through the pages in the report by either clicking on the pages listed below, or by using the keyword search tool below to find specific information within the annual report.-
 1
1 -
2
-
3
-
4
-
5
-
6
-
 7
7 -
 8
8 -
 9
9 -
 10
10 -
 11
11 -
 12
12 -
 13
13 -
 14
14 -
 15
15 -
 16
16 -
 17
17 -
 18
18 -
 19
19 -
 20
20 -
 21
21 -
 22
22 -
 23
23 -
 24
24 -
 25
25 -
 26
26 -
 27
27 -
28
-
29
-
30
-
31
-
32
-
33
-
34
-
35
-
36
-
37
-
38
-
39
-
40
-
41
-
42
-
43
-
44
-
45
-
46
-
47
-
48
-
49
-
50
-
51
-
52
-
53
-
54
-
55
-
56
-
57
-
58
-
59
-
60
-
61
-
62
-
63
-
64
-
65
-
66
-
67
-
68
-
69
-
70
-
71
-
72
-
73
-
74
-
75
-
76
-
77
-
78
-
79
-
80
-
81
-
82
-
83
-
84
-
85
-
86
-
87
-
88
-
89
-
90
-
91
-
92
-
93
-
94
-
95
-
96
-
97
-
98
-
99
-
100
-
101
-
102
-
103
-
104
-
105
-
106
-
107
-
108
-
109
-
110
-
111
-
112
-
113
-
114
-
115
-
116
-
117
-
118
-
119
-
120
-
121
-
122
-
123
-
124
-
125
-
126
-
127
-
128
-
129
-
130
-
131
-
132
-
133
-
134
-
135
-
136
-
137
-
138
-
139
-
140
-
141
-
142
-
143
-
144
-
145
-
146
-
147
-
148
-
149
-
150
-
151
-
152
-
153
-
154
-
155
-
156
-
157
-
158
-
159
-
160
-
161
-
162
-
163
-
164
-
165
-
166
-
167
-
168
-
169
-
170
-
171
-
172
-
173
-
174
-
175
-
176
-
177
-
178
-
179
-
180
-
181
-
182
-
183
-
184
-
185
-
186
-
187
-
188
-
189
-
190
-
191
-
192
-
193
-
194
-
195
-
196
-
197
-
198
-
199
-
200
-
201
-
202
-
203
-
204
-
205
-
206
-
207
-
208
-
209
-
210
-
211
-
212
-
213
-
214
-
215
-
216
-
217
-
218
-
219
-
220
-
221
-
222
-
223
-
224
-
225
-
226
-
227
-
228
-
229
-
230
-
231
-
232
-
233
-
234
-
235
-
236
-
237
-
238
-
239
-
240
-
241
-
242
-
243
-
244
-
245
-
246
-
247
-
248
-
249
-
250
-
251
-
252
-
253
 |
 |

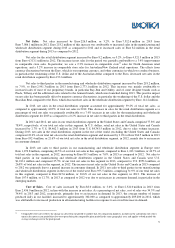
12
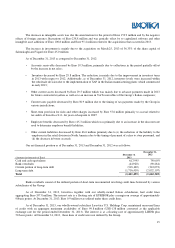
(Amounts in millions of Euro)
Q4
2013
Q4
2012
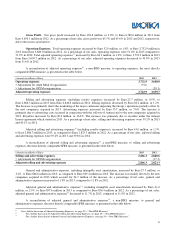
Net income attributable to Luxottica Group stockholders
25.9
74.9
> Adjustment for the cost of the tax audit relating to Luxottica S.r.l. (fiscal year 2007)
26.7
-
> Adjustment for the accrual for the tax audit relating to Luxottica S.r.l. (fiscal years subsequent to 2007)
40.0
> Adjustment for Italian income tax audit
-
10.0
Adjusted net income attributable to Luxottica Group stockholders
92.6
84.9
Basic and diluted earnings per share was Euro 0.05 in the fourth quarter of 2013 as compared to Euro 0.16 in the same period
of 2012. Adjusted basic earnings
21
per share in the fourth quarter of 2013 were Euro 0.20 as compared to Euro 0.18 in the
same period of 2012. Adjusted diluted earnings
21
per share in the fourth quarter of 2013 were Euro 0.19 as compared to Euro
0.18 in the same period of 2012.
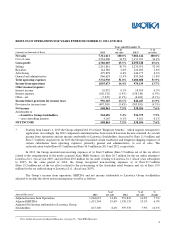
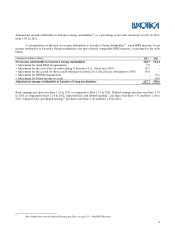
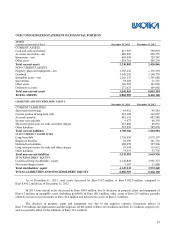
OUR CASH FLOWS
The following table sets forth for the periods indicated certain items included in our statements of consolidated cash
flows included in Item 2 of this report.
As of
December
3
1
,
2013
As of
December
3
1
,
2012
(Amounts in thousands of Euro)
A) Cash and cash equivalents at the beginning of the period 790,093
905,100
B) Net cash provided by operating activities 921,847
1,040,430
C) Cash used in investing activities (479,801)
(478,261)
D) Cash (used in financing activities (568,787)
(668,358)
E) Effect of exchange rate changes on cash and cash equivalents (45,355)
(8,817)
F) Net change in cash and cash equivalents (172,098)
(115,007)
G) Cash and cash equivalents at the end of the period 617,995
790,093
Operating Activities. The Company’s net cash provided by operating activities in 2013 and 2012 was Euro 921.8
million and Euro 1,040.4, respectively.
Depreciation and amortization were Euro 366.6 million in 2013 as compared to Euro 358.3 million in 2012. The
increase in depreciation and amortization in 2013 as compared to 2012 is mainly due to the increase in tangible and
intangible asset purchases and to the acquisition of Alain Mikli.
The change in accounts receivable was Euro (16.8) million in 2013 as compared to (34.6) million in 2012. The
change as led by the higher volume of sales partially offset by an improvement in the collections during 2013 as compared to
2012. The inventory change was Euro 11.8 million in 2013 as compared to Euro (80.5) million in 2012. The change was due
to higher inventory stock levels in 2012 due to the SAP implementation in the Italian manufacturing plants. The change in
accounts payable was Euro 12.5 million in 2013 as compared to Euro 61.5 million in 2012. The change was led by favorable
payment terms and conditions negotiated during 2012. The change in other assets and liabilities was Euro (30.4) million in
2013 as compared to Euro 51.3 million in 2012. The change in 2013 as compared to 2012 was primarily driven by the
decrease in the liability to employees in the retail division in North America due to the timing in payment of salaries to store
personnel (Euro (16.0) million) and a decrease in bonus accruals. Income tax payments in 2013 were Euro 427.9 million as
compared to Euro 265.7 million in 2012. The increase in income tax payments was related to the timing of our tax payments
related to certain Italian subsidiaries in the amount of approximately Euro 103.3 million and to certain US subsidiaries in the
amount of Euro 27.1 million, and the payment of Euro 38.0 million in the last quarter of 2013 related to the tax audit of
Luxottica S.r.l. Interest paid was Euro 94.5 million in 2013 as compared to Euro 120.8 in 2012. The change was mainly due
to repayment of long-term debt.
21
For a further discussion of Adjusted Earnings per Share, see page 29—“Non-IFRS Measures”.