LensCrafters 2013 Annual Report Download - page 39
Download and view the complete annual report
Please find page 39 of the 2013 LensCrafters annual report below. You can navigate through the pages in the report by either clicking on the pages listed below, or by using the keyword search tool below to find specific information within the annual report.-
 1
1 -
2
-
3
-
4
-
5
-
6
-
7
-
8
-
9
-
10
-
11
-
12
-
13
-
14
-
15
-
16
-
17
-
18
-
19
-
20
-
21
-
22
-
23
-
24
-
25
-
26
-
27
-
28
-
 29
29 -
 30
30 -
 31
31 -
 32
32 -
 33
33 -
 34
34 -
 35
35 -
 36
36 -
 37
37 -
 38
38 -
 39
39 -
 40
40 -
 41
41 -
 42
42 -
 43
43 -
 44
44 -
 45
45 -
 46
46 -
 47
47 -
 48
48 -
 49
49 -
50
-
51
-
52
-
53
-
54
-
55
-
56
-
57
-
58
-
59
-
60
-
61
-
62
-
63
-
64
-
65
-
66
-
67
-
68
-
69
-
70
-
71
-
72
-
73
-
74
-
75
-
76
-
77
-
78
-
79
-
80
-
81
-
82
-
83
-
84
-
85
-
86
-
87
-
88
-
89
-
90
-
91
-
92
-
93
-
94
-
95
-
96
-
97
-
98
-
99
-
100
-
101
-
102
-
103
-
104
-
105
-
106
-
107
-
108
-
109
-
110
-
111
-
112
-
113
-
114
-
115
-
116
-
117
-
118
-
119
-
120
-
121
-
122
-
123
-
124
-
125
-
126
-
127
-
128
-
129
-
130
-
131
-
132
-
133
-
134
-
135
-
136
-
137
-
138
-
139
-
140
-
141
-
142
-
143
-
144
-
145
-
146
-
147
-
148
-
149
-
150
-
151
-
152
-
153
-
154
-
155
-
156
-
157
-
158
-
159
-
160
-
161
-
162
-
163
-
164
-
165
-
166
-
167
-
168
-
169
-
170
-
171
-
172
-
173
-
174
-
175
-
176
-
177
-
178
-
179
-
180
-
181
-
182
-
183
-
184
-
185
-
186
-
187
-
188
-
189
-
190
-
191
-
192
-
193
-
194
-
195
-
196
-
197
-
198
-
199
-
200
-
201
-
202
-
203
-
204
-
205
-
206
-
207
-
208
-
209
-
210
-
211
-
212
-
213
-
214
-
215
-
216
-
217
-
218
-
219
-
220
-
221
-
222
-
223
-
224
-
225
-
226
-
227
-
228
-
229
-
230
-
231
-
232
-
233
-
234
-
235
-
236
-
237
-
238
-
239
-
240
-
241
-
242
-
243
-
244
-
245
-
246
-
247
-
248
-
249
-
250
-
251
-
252
-
253
 |
 |
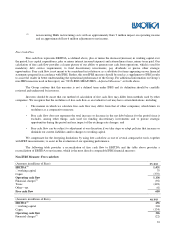
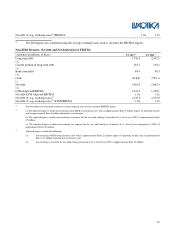
34
Taxes (189)
Other—net (3)
Free cash flow
112
(1)
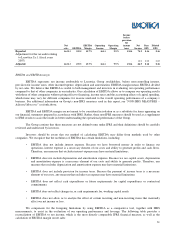
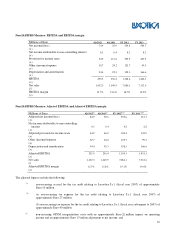
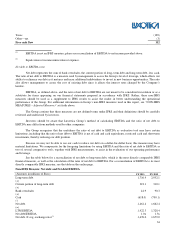
EBITDA is not an IFRS measure; please see reconciliation of EBITDA to net income provided above.
(2)
Equals interest income minus interest expense.
Net debt to EBITDA ratio
Net debt represents the sum of bank overdrafts, the current portion of long- term debt and long-term debt, less cash.
The ratio of net debt to EBITDA is a measure used by management to assess the Group’s level of leverage, which affects our
ability to refinance our debt as it matures and incur additional indebtedness to invest in new business opportunities. The ratio
also allows management to assess the cost of existing debt since it affects the interest rates charged by the Company’s
lenders.
EBITDA, as defined above, and the ratio of net debt to EBITDA are not meant to be considered in isolation or as a
substitute for items appearing on our financial statements prepared in accordance with IFRS. Rather, these non-IFRS
measures should be used as a supplement to IFRS results to assist the reader in better understanding the operational
performance of the Group. For additional information on Group’s non-IFRS measures used in this report, see “NON-IFRS
MEASURES – Adjusted Measures” set forth above.
The Group cautions that these measures are not defined terms under IFRS and their definitions should be carefully
reviewed and understood by investors.
Investors should be aware that Luxottica Group’s method of calculating EBITDA and the ratio of net debt to
EBITDA may differ from methods used by other companies.
The Group recognizes that the usefulness the ratio of net debt to EBITDA as evaluative tool may have certain
limitations, including that the ratio of net debt to EBITDA is net of cash and cash equivalents, restricted cash and short-term
investments, thereby reducing our debt position.
Because we may not be able to use our cash to reduce our debt on a dollar-for-dollar basis, this measure may have
material limitations. We compensate for the foregoing limitations by using EBITDA and the ratio of net debt to EBITDA as
two of several comparative tools, together with IFRS measurements, to assist in the evaluation of our operating performance
and leverage.
See the table below for a reconciliation of net debt to long-term debt, which is the most directly comparable IFRS
financial measure, as well as the calculation of the ratio of net debt to EBITDA. For a reconciliation of EBITDA to its most
directly comparable IFRS measure, see the table on the earlier page.
Non-IFRS Measure: Net debt and Net debt/EBITDA
(Amounts in millions of Euro)
FY 2013
FY 2012
Long-term debt 1,716.4
2,052.1
(+)
Current portion of long-term debt 318.1
310.1
(+)
Bank overdrafts 44.9
90.3
(+)
Cash (618.0)
(790.1)
(-)
Net debt 1,461.4
1,662.4
(=)
LTM EBITDA 1,422.3
1,328.4
Net debt/EBITDA 1.0x
1.3x
Net debt @ avg. exchange rates
(1)
1,476.0
1,679.0