LensCrafters 2013 Annual Report Download - page 134
Download and view the complete annual report
Please find page 134 of the 2013 LensCrafters annual report below. You can navigate through the pages in the report by either clicking on the pages listed below, or by using the keyword search tool below to find specific information within the annual report.-
 1
1 -
2
-
3
-
4
-
5
-
6
-
7
-
8
-
9
-
10
-
11
-
12
-
13
-
14
-
15
-
16
-
17
-
18
-
19
-
20
-
21
-
22
-
23
-
24
-
25
-
26
-
27
-
28
-
29
-
30
-
31
-
32
-
33
-
34
-
35
-
36
-
37
-
38
-
39
-
40
-
41
-
42
-
43
-
44
-
45
-
46
-
47
-
48
-
49
-
50
-
51
-
52
-
53
-
54
-
55
-
56
-
57
-
58
-
59
-
60
-
61
-
62
-
63
-
64
-
65
-
66
-
67
-
68
-
69
-
70
-
71
-
72
-
73
-
74
-
75
-
76
-
77
-
78
-
79
-
80
-
81
-
82
-
83
-
84
-
85
-
86
-
87
-
88
-
89
-
90
-
91
-
92
-
93
-
94
-
95
-
96
-
97
-
98
-
99
-
100
-
101
-
102
-
103
-
104
-
105
-
106
-
107
-
108
-
109
-
110
-
111
-
112
-
113
-
114
-
115
-
116
-
117
-
118
-
119
-
120
-
121
-
122
-
123
-
 124
124 -
 125
125 -
 126
126 -
 127
127 -
 128
128 -
 129
129 -
 130
130 -
 131
131 -
 132
132 -
 133
133 -
 134
134 -
 135
135 -
 136
136 -
 137
137 -
 138
138 -
 139
139 -
 140
140 -
 141
141 -
 142
142 -
 143
143 -
 144
144 -
145
-
146
-
147
-
148
-
149
-
150
-
151
-
152
-
153
-
154
-
155
-
156
-
157
-
158
-
159
-
160
-
161
-
162
-
163
-
164
-
165
-
166
-
167
-
168
-
169
-
170
-
171
-
172
-
173
-
174
-
175
-
176
-
177
-
178
-
179
-
180
-
181
-
182
-
183
-
184
-
185
-
186
-
187
-
188
-
189
-
190
-
191
-
192
-
193
-
194
-
195
-
196
-
197
-
198
-
199
-
200
-
201
-
202
-
203
-
204
-
205
-
206
-
207
-
208
-
209
-
210
-
211
-
212
-
213
-
214
-
215
-
216
-
217
-
218
-
219
-
220
-
221
-
222
-
223
-
224
-
225
-
226
-
227
-
228
-
229
-
230
-
231
-
232
-
233
-
234
-
235
-
236
-
237
-
238
-
239
-
240
-
241
-
242
-
243
-
244
-
245
-
246
-
247
-
248
-
249
-
250
-
251
-
252
-
253
 |
 |

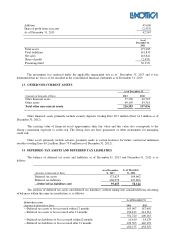
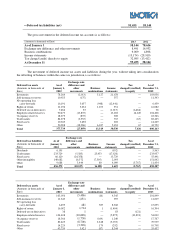
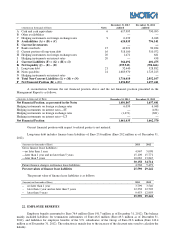
(Amounts in thousands of Euro)
Notes
December 31, 2013
audited
December 31, 2012
audited
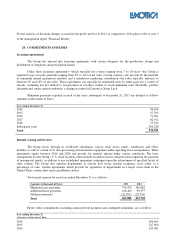
A Cash and cash equivalents 6
617,995
790,093
B Other availabilities
—
—
C Hedging instruments on foreign exchange rates 9
6,039
6,048
D Availabilities (A) + (B) + (C)
624,035
796,141
E Current Investments
—
—
F Bank overdrafts 15
44,921
90,284
G Current portion of long-term debt 16
318,100
310,072
H Hedging instruments on foreign exchange rates 20
1,471
681
I Hedging instruments on interest rates 20
—
438
J Current Liabilities (F) + (G) + (H) + (I)
364,492
401,475
K
Net Liquidity (J) − (E) − (D)
(259,543)
(394,666)
L Long-term debt 21
32,440
328,882
M
Notes payables 21
1,683,970
1,723,225
N Hedging instruments on interest rates
—
—
O
Total Non-Current Liabilities (L) + (M) + (N)
1,716,410
2,052,107
P Net Financial Position (K) + (O)
1,456,867
1,657,441
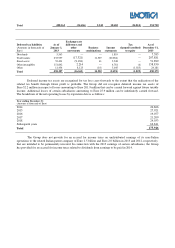
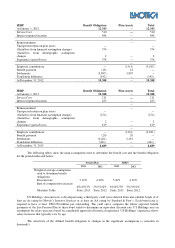
A reconciliation between the net financial position above and the net financial position presented in the
Management Report is as follows:
(Amounts in thousands of Euro)
December 31, 2013
December 31, 2012
Net Financial Position, as presented in the Notes 1,456,867
1,657,441
Hedging instruments on foreign exchange rates 6,039
6,048
Hedging instruments on interest rates—ST —
(438)
Hedging instruments on foreign exchange rates (1,471)
(681)
Hedging instruments on interest rates—LT —
—
Net Financial Position 1,461,435
1,662,370
Our net financial position with respect to related parties is not material.
Long-term debt includes finance lease liabilities of Euro 25.6 million (Euro 29.2 million as of December 31,
2012).
(Amounts in thousands of Euro)
2013 2012
Gross finance lease liabilities:
—no later than 1 year 4,967
5,098
—later than 1 year and no later than 5 years 15,109
15,771
—later than 5 years 10,082
13,845
30,158
34,714
Future finance charges on finance lease liabilities 4,568
5,472
Present values of finance lease liabilities
25,590
29,242
The present value of finance lease liabilities is as follows:
(Amounts in thousands of Euro)
2013 2012
– no later than 1 year 3,799
3,546
– later than 1 year and no later than 5 years 12,338
12,703
– later than 5 years 9,453
12,993
25,590
29,242
22. EMPLOYEE BENEFITS
Employee benefits amounted to Euro 76.4 million (Euro 191.7 million as of December 31, 2012). The balance
mainly included liabilities for termination indemnities of Euro 46.8 million (Euro 49.3 million as of December 31,
2012), and liabilities for employee benefits of the U.S. subsidiaries of the Group of Euro 29.6 million (Euro 142.4
million as of December 31, 2012). The reduction is mainly due to the increase of the discount rates used to calculate the
liability.