LensCrafters 2013 Annual Report Download - page 164
Download and view the complete annual report
Please find page 164 of the 2013 LensCrafters annual report below. You can navigate through the pages in the report by either clicking on the pages listed below, or by using the keyword search tool below to find specific information within the annual report.-
 1
1 -
2
-
3
-
4
-
5
-
6
-
7
-
8
-
9
-
10
-
11
-
12
-
13
-
14
-
15
-
16
-
17
-
18
-
19
-
20
-
21
-
22
-
23
-
24
-
25
-
26
-
27
-
28
-
29
-
30
-
31
-
32
-
33
-
34
-
35
-
36
-
37
-
38
-
39
-
40
-
41
-
42
-
43
-
44
-
45
-
46
-
47
-
48
-
49
-
50
-
51
-
52
-
53
-
54
-
55
-
56
-
57
-
58
-
59
-
60
-
61
-
62
-
63
-
64
-
65
-
66
-
67
-
68
-
69
-
70
-
71
-
72
-
73
-
74
-
75
-
76
-
77
-
78
-
79
-
80
-
81
-
82
-
83
-
84
-
85
-
86
-
87
-
88
-
89
-
90
-
91
-
92
-
93
-
94
-
95
-
96
-
97
-
98
-
99
-
100
-
101
-
102
-
103
-
104
-
105
-
106
-
107
-
108
-
109
-
110
-
111
-
112
-
113
-
114
-
115
-
116
-
117
-
118
-
119
-
120
-
121
-
122
-
123
-
124
-
125
-
126
-
127
-
128
-
129
-
130
-
131
-
132
-
133
-
134
-
135
-
136
-
137
-
138
-
139
-
140
-
141
-
142
-
143
-
144
-
145
-
146
-
147
-
148
-
149
-
150
-
151
-
152
-
153
-
 154
154 -
 155
155 -
 156
156 -
 157
157 -
 158
158 -
 159
159 -
 160
160 -
 161
161 -
 162
162 -
 163
163 -
 164
164 -
 165
165 -
 166
166 -
 167
167 -
 168
168 -
 169
169 -
 170
170 -
 171
171 -
 172
172 -
 173
173 -
 174
174 -
175
-
176
-
177
-
178
-
179
-
180
-
181
-
182
-
183
-
184
-
185
-
186
-
187
-
188
-
189
-
190
-
191
-
192
-
193
-
194
-
195
-
196
-
197
-
198
-
199
-
200
-
201
-
202
-
203
-
204
-
205
-
206
-
207
-
208
-
209
-
210
-
211
-
212
-
213
-
214
-
215
-
216
-
217
-
218
-
219
-
220
-
221
-
222
-
223
-
224
-
225
-
226
-
227
-
228
-
229
-
230
-
231
-
232
-
233
-
234
-
235
-
236
-
237
-
238
-
239
-
240
-
241
-
242
-
243
-
244
-
245
-
246
-
247
-
248
-
249
-
250
-
251
-
252
-
253
 |
 |

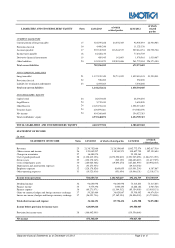
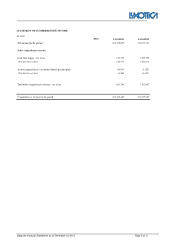
Separate financial Statements as of December 31,2013 Page 4 of 6
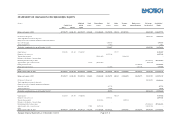
STATEMENT OF CHANGES IN STOCKHOLDERS' EQUITY
(in euro) Additional Legal Extraordinary
IAS Other Treasury Equity reserve Net income Stockholders’
Capital Stock paid-in reserve reserve reserve reserve shares (merger/demerger) for the period Equity
Shares Amount capital
Balances at January 1, 2012 467,351,677 28,041,101 164,335,957 5,601,411 1,011,894,206 569,378,978 156,598 (117,417,600) 180,887,125 1,842,877,776
Net income for the period 354,027,383 354,027,383
Total comprehensive income for the period
Change in fair value of financial instruments without fiscal effect for
7,505,759 7,505,759
Euro 3,581 thousand
Actuarial gains/losses (3,152) (3,152)
Total other comprehensive income at December 31, 2012 7,502,607 354,027,383 361,529,990
Capital increase 5,886,520 353,191 87,498,567 257,727 88,109,485
Figurative stock option cost 41,275,116 41,275,116
Treasury shares granted (25,489,145) 25,489,145 -
Recharge to subsidiaries of treasury shares -
Dividends paid (Euro 0,49 per share) (227,385,895) (227,385,895)
Apportionment of prior year net income 23,397 (46,522,167) 46,498,770 -
Demerger Luxottica S.r.l. 138,706,859 138,706,859
Merger Luxottica Stars S.r.l. (22,130) 9,618,114 9,595,984
Other
Balances at December 31, 2012 473,238,197 28,394,292 251,834,524 5,624,808 939,882,894 618,134,571 414,325 (91,928,455) 148,324,973 354,027,383 2,254,709,315
Balances at January 1, 2013 473,238,197 28,394,292 251,834,524 5,624,808 939,882,894 618,134,571 414,325 (91,928,455) 148,324,973 354,027,383 2,254,709,315
Net income for the period 454,366,669 454,366,669
Total comprehensive income for the period
Change in fair value of financial instruments with maturity
317,770 317,770
date in the year 2013
Actuarial gains/losses 84,010 84,010
Total other comprehensive income at December 31, 2013 401,780 454,366,669 454,768,449
Capital increase 4,322,476 259,348 75,420,801 414,325 75,265,824
Figurative stock option cost 24,593,921 24,593,921
Treasury shares granted (8,868,594) 8,868,594 -
Recharge to subsidiaries of treasury shares -
Dividends paid (Euro 0,49 per share) (273,688,638) (273,688,638)
Apportionment of prior year net income 87,602 80,251,143 (80,338,745) -
Other
Balances at December 31, 2013 477,560,673 28,653,640 327,255,325 5,712,410 1,011,265,443 643,130,272 (83,059,861) 148,324,973 454,366,669 2,535,648,871