LensCrafters 2013 Annual Report Download - page 165
Download and view the complete annual report
Please find page 165 of the 2013 LensCrafters annual report below. You can navigate through the pages in the report by either clicking on the pages listed below, or by using the keyword search tool below to find specific information within the annual report.-
 1
1 -
2
-
3
-
4
-
5
-
6
-
7
-
8
-
9
-
10
-
11
-
12
-
13
-
14
-
15
-
16
-
17
-
18
-
19
-
20
-
21
-
22
-
23
-
24
-
25
-
26
-
27
-
28
-
29
-
30
-
31
-
32
-
33
-
34
-
35
-
36
-
37
-
38
-
39
-
40
-
41
-
42
-
43
-
44
-
45
-
46
-
47
-
48
-
49
-
50
-
51
-
52
-
53
-
54
-
55
-
56
-
57
-
58
-
59
-
60
-
61
-
62
-
63
-
64
-
65
-
66
-
67
-
68
-
69
-
70
-
71
-
72
-
73
-
74
-
75
-
76
-
77
-
78
-
79
-
80
-
81
-
82
-
83
-
84
-
85
-
86
-
87
-
88
-
89
-
90
-
91
-
92
-
93
-
94
-
95
-
96
-
97
-
98
-
99
-
100
-
101
-
102
-
103
-
104
-
105
-
106
-
107
-
108
-
109
-
110
-
111
-
112
-
113
-
114
-
115
-
116
-
117
-
118
-
119
-
120
-
121
-
122
-
123
-
124
-
125
-
126
-
127
-
128
-
129
-
130
-
131
-
132
-
133
-
134
-
135
-
136
-
137
-
138
-
139
-
140
-
141
-
142
-
143
-
144
-
145
-
146
-
147
-
148
-
149
-
150
-
151
-
152
-
153
-
154
-
 155
155 -
 156
156 -
 157
157 -
 158
158 -
 159
159 -
 160
160 -
 161
161 -
 162
162 -
 163
163 -
 164
164 -
 165
165 -
 166
166 -
 167
167 -
 168
168 -
 169
169 -
 170
170 -
 171
171 -
 172
172 -
 173
173 -
 174
174 -
 175
175 -
176
-
177
-
178
-
179
-
180
-
181
-
182
-
183
-
184
-
185
-
186
-
187
-
188
-
189
-
190
-
191
-
192
-
193
-
194
-
195
-
196
-
197
-
198
-
199
-
200
-
201
-
202
-
203
-
204
-
205
-
206
-
207
-
208
-
209
-
210
-
211
-
212
-
213
-
214
-
215
-
216
-
217
-
218
-
219
-
220
-
221
-
222
-
223
-
224
-
225
-
226
-
227
-
228
-
229
-
230
-
231
-
232
-
233
-
234
-
235
-
236
-
237
-
238
-
239
-
240
-
241
-
242
-
243
-
244
-
245
-
246
-
247
-
248
-
249
-
250
-
251
-
252
-
253
 |
 |

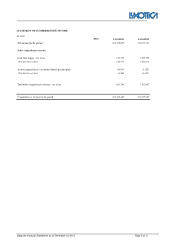
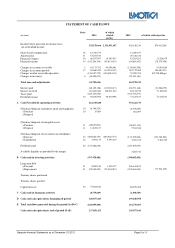
Separate financial Statements as of December 31,2013 Page 5 of 6
STATEMENT OF CASH FLOWS
(in euro)
Notes
2013
of which
related
parties
2012 of which related parties
Income before provision for income taxes,
net of dividend income
524,178,666
1,153,051,655
420,168,214
879,418,268
Share-based compensation
32
12,350,775
21,469,677
Amortization
31
53,273,533
49,316,332
Financial Charges
36
68,297,587
10,385,417
83,283,281
11,226,079
Financial income
35
(102,206,394)
(99,631,453)
(85,864,492)
(78,379,558)
Changes in accounts receivable
5
61,175,792
44,008,461
(115,849,208)
97,693,065
Changes in accounts payable
17
62,669,429
(14,554,347)
182,772,408
104,485,374
Changes in other receivables/payables
(150,857,275)
(130,658,194)
52,298,702
102,798,848qaz
Changes in inventory
6
(16,489,073)
(25,150,161)
Total non-cash adjustments
(11,785,626)
162,278,539
Interest paid
(68,165,188)
(10,385,417)
(84,271,148)
(11,226,079)
Interest received
103,602,844
100,871,234
85,134,972
77,180,833
Taxes paid
(222,103,054)
(103,513,677)
Dividend income
34
96,630,998
96,630,998
73,415,833
73,415,833
A
Cash Provided by operating activities
422,358,640
553,212,733
(Purchase)/disposal of property, plant and equipment
10
(6,346,524)
(8,355,600)
§ Purchase
10
15,869
601,299
§ Disposal
(Purchase)/disposal of intangible assets
§ Purchase
11
(45,047,091)
(36,267,113)
§ Disposal
11
11,815,137
5,541,366
(Purchase)/disposal of investments in subsidiaries
§ Increase
12
(289,820,353)
(289,820,353)
(131,765,624)
(131,765,624)
§ Liquidation
12
5,593,119
5,593,119
5,383,335
5,383,335
Dividends paid
24
(273,688,638)
(227,385,895)
Available liquidity as provided by the merger
2,202,741
B
Cash used in investing activities
(597,478,481)
(390,045,491)
Long-term debt
§ Proceeds
21
8,859,510
1,520,177
506,163,815
§ Repayments
21
(92,904,983)
(22,904,983)
(595,663,849)
(77,534,339)
Treasury shares purchased
Treasury shares granted
Capital increase
24
75,265,824
88,109,485
C
Cash used in financing activities
(8,779,649)
(1,390,549)
D
Cash and cash equivalents, beginning of period
320,957,643
159,180,950
E
Total cash flow generated during the period (A+B+C)
(183,899,490)
161,776,693
Cash and cash equivalents, end of period (D+E)
137,058,153
320,957,643