HTC 2013 Annual Report Download - page 92
Download and view the complete annual report
Please find page 92 of the 2013 HTC annual report below. You can navigate through the pages in the report by either clicking on the pages listed below, or by using the keyword search tool below to find specific information within the annual report.-
 1
1 -
2
-
3
-
4
-
5
-
6
-
7
-
8
-
9
-
10
-
11
-
12
-
13
-
14
-
15
-
16
-
17
-
18
-
19
-
20
-
21
-
22
-
23
-
24
-
25
-
26
-
27
-
28
-
29
-
30
-
31
-
32
-
33
-
34
-
35
-
36
-
37
-
38
-
39
-
40
-
41
-
42
-
43
-
44
-
45
-
46
-
47
-
48
-
49
-
50
-
51
-
52
-
53
-
54
-
55
-
56
-
57
-
58
-
59
-
60
-
61
-
62
-
63
-
64
-
65
-
66
-
67
-
68
-
69
-
70
-
71
-
72
-
73
-
74
-
75
-
76
-
77
-
78
-
79
-
80
-
81
-
 82
82 -
 83
83 -
 84
84 -
 85
85 -
 86
86 -
 87
87 -
 88
88 -
 89
89 -
 90
90 -
 91
91 -
 92
92 -
 93
93 -
 94
94 -
 95
95 -
 96
96 -
 97
97 -
 98
98 -
 99
99 -
 100
100 -
 101
101 -
 102
102 -
103
-
104
-
105
-
106
-
107
-
108
-
109
-
110
-
111
-
112
-
113
-
114
-
115
-
116
-
117
-
118
-
119
-
120
-
121
-
122
-
123
-
124
-
125
-
126
-
127
-
128
-
129
-
130
-
131
-
132
-
133
-
134
-
135
-
136
-
137
-
138
-
139
-
140
-
141
-
142
-
143
-
144
-
145
-
146
-
147
-
148
-
149
-
150
-
151
-
152
-
153
-
154
-
155
-
156
-
157
-
158
-
159
-
160
-
161
-
162
 |
 |

FINANCIAL INFORMATION FINANCIAL INFORMATION
180 181
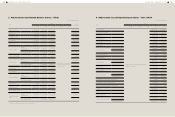
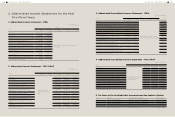
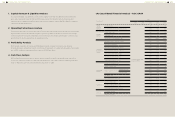
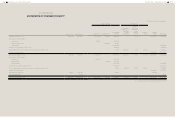
HTC CORPORATION
STATEMENTS OF CASH FLOWS
(In Thousands of New Taiwan Dollars)
For the Years Ended
December 31
2013 2012
CASH FLOWS FROM OPERATING ACTIVITIES
(Loss) profit before income tax
Adjustments for:
Depreciation
Amortization
Impairment loss recognized on trade receivables
Finance costs
Interest income
Compensation cost of employee share options
Share of the profit or loss of associates and joint ventures
Transfer of property, plant and equipment to expenses
Gain on disposal of intangible assets
Gain on sale of available-for-sale financial assets
Impairment losses on non-financial assets
Unrealized gain on sales
Realized gain on sales
Ineffective portion of cash flow hedges
Changes in operating assets and liabilities
(Increase) decrease in financial instruments held for trading
Decrease in note and trade receivables
Decrease in trade receivables - related parties
(Increase) decrease in other receivables
Decrease in other receivables - related parties
Decrease in inventories
Decrease (increase) in prepayments
(Increase) decrease in other current assets
(Increase) decrease in other non-current assets
(Decrease) increase in note and trade payables
Increase (decrease) in trade payable - related parties
Increase (decrease) in other payables
Decrease in provisions
(Decrease) increase in other current liabilities
$(1,285,207)
1,602,946
651,632
991,821
6,550
(426,679)
23,443
1,075,872
1,581
(110,602)
-
550,224
1,611,132
(2,354,363)
10,467
(155,347)
4,785,320
6,264,553
(555,055)
33,295
1,619,172
48,433
(90,882)
(1,933,827)
(25,938,861)
2,719,034
2,129,687
(2,879,080)
(654,251)
$16,932,710
1,292,949
524,391
505,078
320
(504,794)
-
(617,723)
5,912
-
(7,695)
1,256,571
2,354,363
(1,151,531)
(10,467)
249,918
11,790,935
13,509,139
301,456
45,446
3,655,799
(585,542)
213,948
560,878
1,276,175
(736,246)
(11,861,840)
(7,204,428)
32,860
(Continued)
For the Years Ended
December 31
2013 2012
Cash (used in) generated from operations
Interest received
Interest paid
Income tax paid
(12,258,992)
473,600
(6,550)
(1,451,420)
31,828,582
475,053
(320)
(9,570,678)
Net cash (used in) generated from operating activities (13,243,362) 22,732,637
CASH FLOWS FROM INVESTING ACTIVITIES
Proceeds on sale of available-for-sale financial assets
Recovery of the principal amount of held-to-maturity investments
Net cash inflow on disposal of subsidiaries
Payments for property, plant and equipment
Increase in refundable deposits
Decrease in refundable deposits
Increase in other receivables - related parties
Decrease in other receivables - related parties
Payments for intangible assets
Proceeds from disposal of intangible assets
Decrease in other current financial assets
Dividend received
-
100,000
22
(2,367,429)
-
9,866
-
6,554,025
(193,526)
117,380
3,247,679
7,655
739,095
100,000
-
(5,260,452)
(6,053)
-
(6,554,025)
-
-
-
19,931,930
1,744
Net cash generated from investing activities 7,475,672 8,952,239
CASH FLOWS FROM FINANCING ACTIVITIES
Payments for treasury shares
Increase in guarantee deposits received
Decrease in guarantee deposits received
Net cash outflow on acquisition of subsidiaries
Dividends paid to owners of the Company
(1,033,846)
1,160
-
(1,048,594)
(1,662,455)
(3,700,346)
-
(628)
(5,586,458)
(33,249,085)
Net cash used in financing activities (3,743,735) (42,536,517)
NET DECREASE IN CASH AND CASH EQUIVALENTS
CASH AND CASH EQUIVALENTS, BEGINNING OF THE YEAR
(9,511,425)
42,545,929
(10,851,641)
53,397,570
CASH AND CASH EQUIVALENTS, END OF THE YEAR $33,034,504 $42,545,929
The accompanying notes are an integral part of the financial statements.
(Concluded)