HTC 2013 Annual Report Download - page 106
Download and view the complete annual report
Please find page 106 of the 2013 HTC annual report below. You can navigate through the pages in the report by either clicking on the pages listed below, or by using the keyword search tool below to find specific information within the annual report.-
 1
1 -
2
-
3
-
4
-
5
-
6
-
7
-
8
-
9
-
10
-
11
-
12
-
13
-
14
-
15
-
16
-
17
-
18
-
19
-
20
-
21
-
22
-
23
-
24
-
25
-
26
-
27
-
28
-
29
-
30
-
31
-
32
-
33
-
34
-
35
-
36
-
37
-
38
-
39
-
40
-
41
-
42
-
43
-
44
-
45
-
46
-
47
-
48
-
49
-
50
-
51
-
52
-
53
-
54
-
55
-
56
-
57
-
58
-
59
-
60
-
61
-
62
-
63
-
64
-
65
-
66
-
67
-
68
-
69
-
70
-
71
-
72
-
73
-
74
-
75
-
76
-
77
-
78
-
79
-
80
-
81
-
82
-
83
-
84
-
85
-
86
-
87
-
88
-
89
-
90
-
91
-
92
-
93
-
94
-
95
-
 96
96 -
 97
97 -
 98
98 -
 99
99 -
 100
100 -
 101
101 -
 102
102 -
 103
103 -
 104
104 -
 105
105 -
 106
106 -
 107
107 -
 108
108 -
 109
109 -
 110
110 -
 111
111 -
 112
112 -
 113
113 -
 114
114 -
 115
115 -
 116
116 -
117
-
118
-
119
-
120
-
121
-
122
-
123
-
124
-
125
-
126
-
127
-
128
-
129
-
130
-
131
-
132
-
133
-
134
-
135
-
136
-
137
-
138
-
139
-
140
-
141
-
142
-
143
-
144
-
145
-
146
-
147
-
148
-
149
-
150
-
151
-
152
-
153
-
154
-
155
-
156
-
157
-
158
-
159
-
160
-
161
-
162
 |
 |

FINANCIAL INFORMATION FINANCIAL INFORMATION
208 209
The above items of property, plant and equipment
were depreciated on a straight-line basis at the
following rates per annum:
Building
Machinery and equipment
Other equipment
5-50 years
3-6 years
3-5 years
The major component parts of the buildings held
by the Company included plants, electro-powering
machinery and engineering systems, etc., which
were depreciated over their estimated useful lives
of 40 to 50 years, 20 years and 5 to 10 years,
respectively.
There were no interests capitalized for the years
ended December 31, 2013 and 2012.
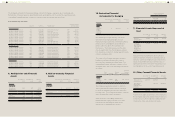
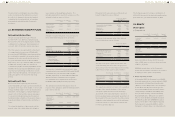
18. INTANGIBLE ASSETS
December 31,
2013
December 31,
2012
January 1,
2012
Carrying amounts
Patents
Other intangible
assets
$1,027,295
623,596
$1,625,340
91,810
$2,120,948
120,593
$1,650,891 $1,717,150 $2,241,541
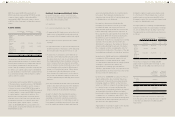
Movements of intangible assets for the years ended
December 31, 2013 and 2012 were as follows:
2013
Patents
Other
Intangible
Assets
Total
Cost
Balance, beginning
of the year
$2,500,854 $141,128 $2,641,982
Additions
Acquisition 22,214 171,312 193,526
Transfer from
prepayment
- 509,710 509,710
Disposal (6,778) - (6,778)
Balance, end of
the year
2,516,290 822,150 3,338,440
Accumulated
amortization
Balance,
beginning of the
year
875,514 49,318 924,832
Amortization
expenses
502,396 149,236 651,632
Balance, end of
the year
1,377,910 198,554 1,576,464
(Continued)
The average term of payment is four months. The
Company has financial risk management policies
in place to ensure that all payables are paid within
the pre-agreed credit terms.
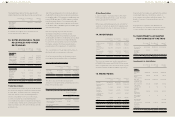
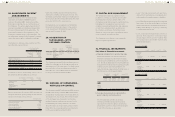
20. OTHER LIABILITIES
December
31, 2013
December
31, 2012
January 1,
2012
Other payables
Accrued expenses
Payables for
purchase of
equipment
Others
$33,004,452
340,961
217,440
$30,873,737
1,119,058
218,468
$42,895,879
348,772
276,802
$33,562,853 $32,211,263 $43,521,453
Other current
liabilities
Advance receipts
Agency receipts
Others
$221,342
173,221
138,242
$86,700
270,073
830,283
$134,748
388,885
630,563
$532,805 $1,187,056 $1,154,196
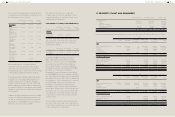
Accrued Expenses
December
31, 2013
December
31, 2012
January 1,
2012
Marketing $19,328,804 $15,531,875 $25,556,956
Salaries and
bonuses
4,037,445 3,545,320 2,599,569
Services 3,340,826 2,429,101 2,760,164
Bonus to
employees
3,278,053 5,712,075 7,238,637
Materials
and molding
expenses
1,650,849 1,900,218 1,848,332
Import, export
and freight
620,775 443,604 1,197,075
Repairs,
maintenance
and sundry
purchase
176,361 391,726 264,044
Others 571,339 919,818 1,431,102
$33,004,452 $30,873,737 $42,895,879
The Company accrued marketing expenses on the
basis of related agreements and other factors that
would significantly affect the accruals.
Other Payables - Others
Other payables - others were payables for patents,
and agreed installments payable to the original
stockholders of subsidiaries.
2013
Patents
Other
Intangible
Assets
Total
Accumulated
impairment
Balance,
beginning of the
year
- - -
Impairment
losses
111,085 - 111,085
Balance, end of
the year
111,085 - 111,085
Net book value,
end of the year
$1,027,295 $623,596 $1,650,891
(Concluded)
2012
Patents
Other
Intangible
Assets
Total
Cost
Balance, beginning
of the year
$2,500,854 $178,133 $2,678,987
Disposal - (37,005) (37,005)
Balance, end of
the year
2,500,854 141,128 2,641,982
Accumulated
amortization
Balance,
beginning of the
year
$379,906 $57,540 $437,446
Amortization
expenses
495,608 28,783 524,391
Disposal - (37,005) (37,005)
Balance, end of
the year
875,514 49,318 924,832
Net book value,
end of the year
$1,625,340 $91,810 $1,717,150
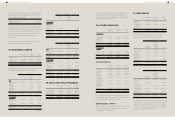
19. NOTE AND TRADE PAYABLES
December 31,
2013
December 31,
2012
January 1,
2012
Note payables
Trade payables
Trade payables
- related parties
$1,355
42,787,368
5,622,019
$294
71,227,290
2,902,985
$3,779
72,851,595
3,639,231
$48,410,742 $74,130,569 $76,494,605
21. PROVISIONS
December 31,
2013
December 31,
2012
January 1,
2012
Warranty
provision
$6,391,787 $6,780,712 $12,755,264
Provisions for
contingent loss
on purchase
orders
832,850 823,005 2,052,881
$7,224,637 $7,603,717 $14,808,145
Movement of provisions for the years ended
December 31, 2013 and 2012 were as follows:
2013
Warranty
Provision
Provisions
for
Contingent
Loss on
Purchase
Orders Total
Balance, beginning
of the year
$6,780,712 $823,005 $7,603,717
Provisions
recognized
12,186,568 359,350 12,545,918
Amount utilized
during the year
(12,679,039) (349,505) (13,028,544)
Translation
adjustment
103,546 - 103,546
Balance, end of
the year
$6,391,787 $832,850 $7,224,637
2012
Warranty
Provision
Provisions
for
Contingent
Loss on
Purchase
Orders Total
Balance, beginning
of the year
$12,755,264 $2,052,881 $14,808,145
Provisions
recognized
8,497,459 - 8,497,459
Reversing un-
usage balances
- (751,363) (751,363)
Amount utilized
during the year
(14,248,587) (478,513) (14,727,100)
Translation
adjustment
(223,424) - (223,424)
Balance, end of
the year
$6,780,712 $823,005 $7,603,717
The Company provides warranty service for its
customers for one year to two years. The warranty
liability is estimated on the basis of evaluation
of the products under warranty, past warranty
experience, and pertinent factors.