HTC 2013 Annual Report Download - page 89
Download and view the complete annual report
Please find page 89 of the 2013 HTC annual report below. You can navigate through the pages in the report by either clicking on the pages listed below, or by using the keyword search tool below to find specific information within the annual report.-
 1
1 -
2
-
3
-
4
-
5
-
6
-
7
-
8
-
9
-
10
-
11
-
12
-
13
-
14
-
15
-
16
-
17
-
18
-
19
-
20
-
21
-
22
-
23
-
24
-
25
-
26
-
27
-
28
-
29
-
30
-
31
-
32
-
33
-
34
-
35
-
36
-
37
-
38
-
39
-
40
-
41
-
42
-
43
-
44
-
45
-
46
-
47
-
48
-
49
-
50
-
51
-
52
-
53
-
54
-
55
-
56
-
57
-
58
-
59
-
60
-
61
-
62
-
63
-
64
-
65
-
66
-
67
-
68
-
69
-
70
-
71
-
72
-
73
-
74
-
75
-
76
-
77
-
78
-
 79
79 -
 80
80 -
 81
81 -
 82
82 -
 83
83 -
 84
84 -
 85
85 -
 86
86 -
 87
87 -
 88
88 -
 89
89 -
 90
90 -
 91
91 -
 92
92 -
 93
93 -
 94
94 -
 95
95 -
 96
96 -
 97
97 -
 98
98 -
 99
99 -
100
-
101
-
102
-
103
-
104
-
105
-
106
-
107
-
108
-
109
-
110
-
111
-
112
-
113
-
114
-
115
-
116
-
117
-
118
-
119
-
120
-
121
-
122
-
123
-
124
-
125
-
126
-
127
-
128
-
129
-
130
-
131
-
132
-
133
-
134
-
135
-
136
-
137
-
138
-
139
-
140
-
141
-
142
-
143
-
144
-
145
-
146
-
147
-
148
-
149
-
150
-
151
-
152
-
153
-
154
-
155
-
156
-
157
-
158
-
159
-
160
-
161
-
162
 |
 |

FINANCIAL INFORMATION FINANCIAL INFORMATION
174 175
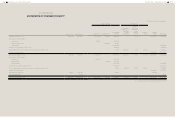
HTC CORPORATION
BALANCE SHEETS
(In Thousands of New Taiwan Dollars)
ASSETS
December 31, 2013 December 31, 2012 January 1, 2012
Amount %Amount %Amount %
CURRENT ASSETS
Cash and cash equivalents (Note 6) $33,034,504 20 $42,545,929 22 $53,397,570 22
Financial assets at fair value through profit or
loss - current (Notes 7 and 32)
162,297 - 6,950 - 256,868 -
Available-for-sale financial assets - current
(Notes 8 and 32)
- - - - 736,031 -
Held-to-maturity financial assets - current
(Notes 9 and 32)
- - 101,459 - - -
Derivative financial assets for hedging -
current (Notes 10 and 32)
- - 204,519 - - -
Note and trade receivables, net (Note 13) 13,966,622 8 19,743,763 10 32,039,776 13
Trade receivables - related parties, net (Notes
13 and 33)
13,203,577 8 19,468,130 10 32,977,269 13
Other receivables (Note 13) 1,856,060 1 1,300,399 1 1,615,044 1
Other receivables - related parties (Notes 13
and 33)
336 - 6,633,724 3 79,077 -
Current tax assets (Note 26) 24,192 - - - - -
Inventories (Note 14) 18,463,656 11 20,521,967 10 25,389,320 10
Prepayments (Note 15) 3,596,806 2 4,154,949 2 6,473,372 3
Other current financial assets (Notes 6, 12
and 34)
2,359,041 2 5,606,720 3 25,538,650 10
Other current assets 125,019 - 34,137 - 248,085 -
Total current assets 86,792,110 52 120,322,646 61 178,751,062 72
NON-CURRENT ASSETS
Available-for-sale financial assets - non-
current (Notes 8 and 32)
239 - 197 - 279 -
Held-to-maturity financial assets - non-
current (Notes 9 and 32)
- - - - 204,597 -
Financial assets measured at cost - non-
current (Notes 11 and 32)
515,861 - 515,861 - 515,861 -
Investments accounted for using equity
method (Notes 16, 29 and 30)
42,130,349 25 39,781,249 20 35,904,924 15
Property, plant and equipment (Notes 17 and
33)
19,773,608 12 19,726,836 10 15,318,600 6
Intangible assets (Note 18) 1,650,891 1 1,717,150 1 2,241,541 1
Deferred tax assets (Note 26) 6,475,936 4 6,545,718 4 5,359,291 2
Refundable deposits (Note 32) 75,081 - 84,947 - 78,894 -
Prepaid pension cost - non-current (Note 22) 125,894 - 119,522 - 101,026 -
Other non-current assets (Note 15) 10,014,225 6 8,165,713 4 8,645,392 4
Total non-current assets 80,762,084 48 76,657,193 39 68,370,405 28
TOTAL $167,554,194 100 $196,979,839 100 $247,121,467 100
(Continued)
LIABILITIES AND EQUITY
December 31, 2013 December 31, 2012 January 1, 2012
Amount %Amount %Amount %
CURRENT LIABILITIES
Note and trade payables (Note 19) $42,788,723 26 $71,227,584 36 $72,855,374 30
Trade payable - related parties (Notes 19 and
33)
5,622,019 4 2,902,985 1 3,639,231 1
Other payables (Notes 20 and 33) 33,562,853 20 32,211,263 16 43,521,453 18
Current tax liabilities (Note 26) 303 - 1,424,006 1 9,653,090 4
Provisions - current (Note 21) 7,224,637 4 7,603,717 4 14,808,145 6
Other current liabilities (Note 20) 532,805 - 1,187,056 1 1,154,196 -
Total current liabilities 89,731,340 54 116,556,611 59 145,631,489 59
NON-CURRENT LIABILITIES
Deferred tax liabilities (Note 26) 114,034 - 150,534 - 187,469 -
Guarantee deposits received (Note 32) 1,160 - - - 628 -
Total non-current liabilities 115,194 - 150,534 - 188,097 -
Total liabilities 89,846,534 54 116,707,145 59 145,819,586 59
EQUITY (Note 23)
Share capital - common stock 8,423,505 5 8,520,521 4 8,520,521 3
Capital surplus 15,360,307 9 16,601,557 8 16,601,557 7
Retained earnings
Legal reserve 18,149,350 11 16,471,254 9 10,273,674 4
Special reserve 854,138 1 - - 580,856 -
Accumulated earnings 47,282,820 28 53,630,777 27 75,687,478 31
Total retained earnings 66,286,308 40 70,102,031 36 86,542,008 35
Other equity 557,698 - (885,925) - 2,939 -
Treasury shares (12,920,158) (8) (14,065,490) (7) (10,365,144) (4)
Total equity 77,707,660 46 80,272,694 41 101,301,881 41
TOTAL $167,554,194 100 $196,979,839 100 $247,121,467 100
The accompanying notes are an integral part of the financial statements.
(Concluded)