HTC 2013 Annual Report Download - page 154
Download and view the complete annual report
Please find page 154 of the 2013 HTC annual report below. You can navigate through the pages in the report by either clicking on the pages listed below, or by using the keyword search tool below to find specific information within the annual report.-
 1
1 -
2
-
3
-
4
-
5
-
6
-
7
-
8
-
9
-
10
-
11
-
12
-
13
-
14
-
15
-
16
-
17
-
18
-
19
-
20
-
21
-
22
-
23
-
24
-
25
-
26
-
27
-
28
-
29
-
30
-
31
-
32
-
33
-
34
-
35
-
36
-
37
-
38
-
39
-
40
-
41
-
42
-
43
-
44
-
45
-
46
-
47
-
48
-
49
-
50
-
51
-
52
-
53
-
54
-
55
-
56
-
57
-
58
-
59
-
60
-
61
-
62
-
63
-
64
-
65
-
66
-
67
-
68
-
69
-
70
-
71
-
72
-
73
-
74
-
75
-
76
-
77
-
78
-
79
-
80
-
81
-
82
-
83
-
84
-
85
-
86
-
87
-
88
-
89
-
90
-
91
-
92
-
93
-
94
-
95
-
96
-
97
-
98
-
99
-
100
-
101
-
102
-
103
-
104
-
105
-
106
-
107
-
108
-
109
-
110
-
111
-
112
-
113
-
114
-
115
-
116
-
117
-
118
-
119
-
120
-
121
-
122
-
123
-
124
-
125
-
126
-
127
-
128
-
129
-
130
-
131
-
132
-
133
-
134
-
135
-
136
-
137
-
138
-
139
-
140
-
141
-
142
-
143
-
 144
144 -
 145
145 -
 146
146 -
 147
147 -
 148
148 -
 149
149 -
 150
150 -
 151
151 -
 152
152 -
 153
153 -
 154
154 -
 155
155 -
 156
156 -
 157
157 -
 158
158 -
 159
159 -
 160
160 -
 161
161 -
 162
162
 |
 |

FINANCIAL INFORMATION FINANCIAL INFORMATION
304 305
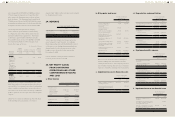
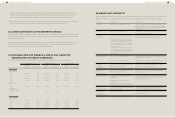
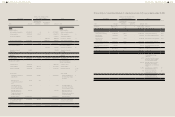
39. SEGMENT INFORMATION
Information reported to the chief operating decision maker for the purposes of resource allocation and
assessment of segment performance focuses on types of goods or services delivered or provided. Under
IFRS 8 - "Operating Segments," the Company is organized and managed as a single reportable business
segment. The Company's operations are mainly in the research, design, manufacture and sale of smart
mobile devices and the operating revenue is more than 90 percent of the total revenue.
Operating segment financial information was as follows:
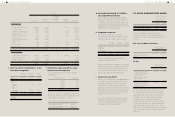
Geographical Areas
The Company's non-current assets (other than financial instruments, deferred tax assets and post-
employment benefit assets) located in Taiwan and in single foreign country as of December 31, 2013,
December 31, 2012 and January 1, 2012 were as follows:
December 31, 2013 December 31, 2012 January 1, 2012
Taiwan
Country Y
Country Z
Others
$31,928,554
4,808,349
411,746
8,816,216
$30,004,905
5,077,921
1,249,807
11,218,055
$26,579,662
5,236,960
10,271,855
13,049,761
$45,964,865 $47,550,688 $55,138,238
The Company's revenues from Taiwan and from single foreign country that were 10 percent or more of
consolidated total revenues for the years ended December 31, 2013 and 2012 were as follows:
For the Year Ended December 31
2013 2012
Taiwan
Country Y
Country Z
Others
$19,882,726
33,008,560
48,673,014
101,838,348
$20,403,572
53,557,704
68,200,497
146,858,402
$203,402,648 $289,020,175
Major Customers
The Company did not have transactions with single external customers whose revenues amounted to 10
percent or more of the Company's total revenues for the years ended December 31, 2013 and 2012.
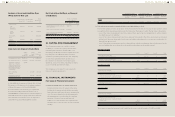
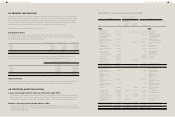
40. FIRST-TIME ADOPTION OF IFRSs
a. Basis of the preparation for financial information under IFRSs
The Company's consolidated financial statements for the year ended December 31, 2013 were the first IFRS
financial statements. The Company not only follows the significant accounting policies stated in Note 4 but
also applies the requirements under IFRS 1 "First-time Adoption of IFRS" as the basis for the preparation.
b. Effect of the transition from ROC GAAP to IFRSs
After transition to IFRSs, the effect on the Company's consolidated balance sheets as of December 31, and
January 1, 2012 as well as the consolidated statements of comprehensive income for the year endedDecember
31, 2012, was stated as follows:
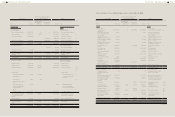
1) Reconciliation of consolidated balance sheet as of January 1, 2012
ROC GAAP
Effect of the Transition from
ROC GAAP to IFRSs IFRSs
Note
Item Amount
Measurement
or
Recognition
Difference
Presentation
Difference Amount Item
Assets Assets
Current assets Current assets
Cash and cash
equivalents
$87,501,508 $- $(25,474,750) $62,026,758 Cash and cash
equivalents
Financial assets at fair
value through profit or
loss - current
256,868 - - 256,868 Financial assets at fair
value through profit or
loss - current
Available-for-sale
financial assets - current
736,031 - - 736,031 Available-for-sale
financial assets - current
Restricted assets -
current
68,700 - 25,474,750 25,543,450 Other current financial
assets
Note and trade
receivables, net
64,719,791 - - 64,719,791 Note and trade
receivables, net
Other current financial
assets
1,947,665 - - 1,947,665 Other receivables
Other receivables -
related parties
966 - - 966 Other receivables -
related parties
Income tax receivables 263,116 - - 263,116 Current tax assets
Inventories 28,430,590 - - 28,430,590 Inventories
Prepayments 6,507,516 - - 6,507,516 Prepayments
Deferred income tax
assets - current
2,246,196 - (2,246,196) - -
Other current assets 249,644 - - 249,644 Other current assets
Total current assets 192,928,591 - (2,246,196) 190,682,395 Total current assets
Non-current assets Non-current assets
Held-to-maturity
financial assets - non-
current
204,597 - - 204,597 Held-to-maturity
financial assets - non-
current
Available-for-sale
financial assets - non-
current
279 - - 279 Available-for-sale
financial assets - non-
current
Financial assets
measured at cost - non-
current
3,408,654 - - 3,408,654 Financial assets
measured at cost - non-
current
Investments accounted
for using the equity
method
71,732 - - 71,732 Investments accounted
for using the equity
method
Properties 21,512,478 - 203,155 21,715,633 Property, plant and
equipment
Intangible assets 22,560,788 (342) 207,033 22,767,479 Intangible assets
Refundable deposits 185,306 - - 185,306 Refundable deposits
Deferred charges 763,516 - (763,516) - -
Deferred income assets
tax - non-current
3,675,521 58,000 2,586,457 6,319,978 Deferred tax assets
Prepaid pension cost -
non-current
183,703 (83,052) - 100,651 Prepaid pension cost -
non-current
Other non-current assets 10,301,798 - 353,328 10,655,126 Other non-current assets
Total non-current assets 62,868,372 (25,394) 2,586,457 65,429,435 Total non-current assets
Total $255,796,963 $(25,394) $340,261 $256,111,830 Total
(Continued)