HTC 2013 Annual Report Download - page 140
Download and view the complete annual report
Please find page 140 of the 2013 HTC annual report below. You can navigate through the pages in the report by either clicking on the pages listed below, or by using the keyword search tool below to find specific information within the annual report.-
 1
1 -
2
-
3
-
4
-
5
-
6
-
7
-
8
-
9
-
10
-
11
-
12
-
13
-
14
-
15
-
16
-
17
-
18
-
19
-
20
-
21
-
22
-
23
-
24
-
25
-
26
-
27
-
28
-
29
-
30
-
31
-
32
-
33
-
34
-
35
-
36
-
37
-
38
-
39
-
40
-
41
-
42
-
43
-
44
-
45
-
46
-
47
-
48
-
49
-
50
-
51
-
52
-
53
-
54
-
55
-
56
-
57
-
58
-
59
-
60
-
61
-
62
-
63
-
64
-
65
-
66
-
67
-
68
-
69
-
70
-
71
-
72
-
73
-
74
-
75
-
76
-
77
-
78
-
79
-
80
-
81
-
82
-
83
-
84
-
85
-
86
-
87
-
88
-
89
-
90
-
91
-
92
-
93
-
94
-
95
-
96
-
97
-
98
-
99
-
100
-
101
-
102
-
103
-
104
-
105
-
106
-
107
-
108
-
109
-
110
-
111
-
112
-
113
-
114
-
115
-
116
-
117
-
118
-
119
-
120
-
121
-
122
-
123
-
124
-
125
-
126
-
127
-
128
-
129
-
 130
130 -
 131
131 -
 132
132 -
 133
133 -
 134
134 -
 135
135 -
 136
136 -
 137
137 -
 138
138 -
 139
139 -
 140
140 -
 141
141 -
 142
142 -
 143
143 -
 144
144 -
 145
145 -
 146
146 -
 147
147 -
 148
148 -
 149
149 -
 150
150 -
151
-
152
-
153
-
154
-
155
-
156
-
157
-
158
-
159
-
160
-
161
-
162
 |
 |

FINANCIAL INFORMATION FINANCIAL INFORMATION
276 277
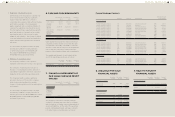
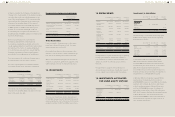
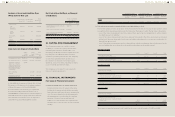
Proceeds of disposal $7,883,326
Less: Carrying amount of investment at the
date of disposal
(5,285,537)
Add: Share of other comprehensive income
of the associate
39,884
Gain recognized $2,637,673
The amount of unrecognized share of losses
of those associates, both for the period and
cumulatively, was as follows:
For the Year Ended December 31
2013 2012
Unrecognized share of
losses of associates
For the period $9,455 $3,606
Accumulated $13,061 $3,606
Investments accounted for using the equity
method and the share of net income or loss and
other comprehensive income from investments
are accounted for based on the audited financial
statements except for SYNCTV Corporation. The
Company's management considers the use of
unaudited financial statements of the investee
did not have material impact on its consolidated
financial statements.
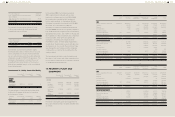
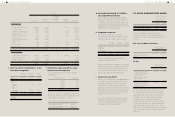
Investments in Jointly Controlled Entity
December 31,
2013
December 31,
2012
January 1,
2012
Unlisted
equity
investments
Huada Digital
Corporation
$227,504 $241,309 $-
The percentage of ownership and voting rights
held by the Company at the end of reporting
period were as follows:
Company
Name
December 31,
2013
December 31,
2012
January 1,
2012
Huada Digital
Corporation
50.00% 50.00% 50.00%
In December 2009, the Company acquired
100% equity interest in Huada, whose main
business is software services, for NT$245,000
thousand and accounted for this investment
by the equity method. In September 2011, the
Company increased its investment by NT$5,000
thousand. As of December 31, 2012, the
Company's investment in Huada had amounted
to NT$250,000 thousand. In September 2011, the
Fair Trade Commission approved an investment by
Chunghwa Telecom Co., Ltd. ("CHT") in Huada and
the registration of this investment was completed
in October 2011. After CHT's investment, the
Company's ownership percentage declined
from 100% to 50%. In March 2012, Huada held a
stockholders' meeting and re-elected its directors
and supervisors. As a result, the investment type
was changed to joint venture and the Company
continued to account for this investment by the
equity method.
The investments in jointly controlled entity and
the share of net income and other comprehensive
income from investments are accounted for based
on audited financial statements.
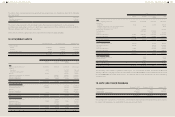
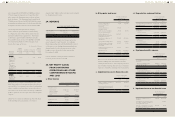
17. PROPERTY, PLANT AND
EQUIPMENT
December 31,
2013
December 31,
2012
January 1,
2012
Carrying
amounts
Land $7,623,287 $7,615,546 $7,614,167
Buildings 10,507,548 10,542,019 5,029,932
Property in
construction
145 - 1,923,876
Machinery
and
equipment
5,761,926 6,327,723 5,907,321
Other
equipment
1,668,493 1,505,478 1,240,337
$25,561,399 $25,990,766 $21,715,633
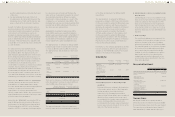
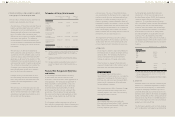
Movement of property, plant and equipment for
the years ended December 31, 2013 and 2012 were
as follows:
2013
Land Buildings Property in
Construction
Machinery and
Equipment
Other
Equipment Total
Cost
Balance, beginning of the year $7,615,546 $11,851,900 $- $13,310,647 $2,787,808 $35,565,901
Additions - 252,735 6,683 1,178,694 797,615 2,235,727
Disposal - (5,995) - (138,393) (102,601) (246,989)
Reclassification - 5,275 (4,958) (88,006) 87,689 -
Transfer to expense - - (1,581) - (1,436) (3,017)
Translation adjustment 7,741 125,676 1 217,970 87,336 438,724
Disposal of subsidiaries - - - - (91,527) (91,527)
Balance, end of the year 7,623,287 12,229,591 145 14,480,912 3,564,884 37,898,819
Accumulated depreciation
Balance, beginning of the year - 1,309,881 - 6,982,924 1,282,330 9,575,135
Depreciation expenses - 399,036 - 1,824,620 693,043 2,916,699
Disposal - (5,995) - (138,219) (100,108) (244,322)
Reclassification - 11,434 - (35,096) 23,662 -
Transfer to expense - - - - (22) (22)
Translation adjustment - 7,687 - 84,757 36,720 129,164
Disposal of subsidiaries - - - - (39,234) (39,234)
Balance, end of the year - 1,722,043 - 8,718,986 1,896,391 12,337,420
Net book value, end of the year $7,623,287 $10,507,548 $145 $5,761,926 $1,668,493 $25,561,399
2012
Land Buildings Property in
Construction
Machinery and
Equipment
Other
Equipment Total
Cost
Balance, beginning of the year $7,614,167 $6,047,519 $1,923,876 $11,470,702 $2,040,507 $29,096,771
Additions 208 226,585 3,916,745 2,110,556 1,027,021 7,281,115
Disposal - (468) - (202,421) (72,126) (275,015)
Reclassification - 5,615,958 (5,834,709) - 115 (218,636)
Transfer to expense - - (5,912) (2,520) (6,666) (15,098)
Translation adjustment 1,171 (37,694) - (65,670) (20,807) (123,000)
Disposal of subsidiaries - - - - (180,236) (180,236)
Balance, end of the year 7,615,546 11,851,900 - 13,310,647 2,787,808 35,565,901
Accumulated depreciation
Balance, beginning of the year - 1,017,587 - 5,563,381 800,170 7,381,138
Depreciation expenses - 307,379 - 1,620,750 534,888 2,463,017
Disposal - (449) - (173,298) (55,984) (229,731)
Translation adjustment - (14,636) - (27,909) 13,964 (28,581)
Disposal of subsidiaries - - - - (10,708) (10,708)
Balance, end of the year - 1,309,881 - 6,982,924 1,282,330 9,575,135
Net book value, end of the year $7,615,546 $10,542,019 $- $6,327,723 $1,505,478 $25,990,766