HTC 2013 Annual Report Download - page 117
Download and view the complete annual report
Please find page 117 of the 2013 HTC annual report below. You can navigate through the pages in the report by either clicking on the pages listed below, or by using the keyword search tool below to find specific information within the annual report.-
 1
1 -
2
-
3
-
4
-
5
-
6
-
7
-
8
-
9
-
10
-
11
-
12
-
13
-
14
-
15
-
16
-
17
-
18
-
19
-
20
-
21
-
22
-
23
-
24
-
25
-
26
-
27
-
28
-
29
-
30
-
31
-
32
-
33
-
34
-
35
-
36
-
37
-
38
-
39
-
40
-
41
-
42
-
43
-
44
-
45
-
46
-
47
-
48
-
49
-
50
-
51
-
52
-
53
-
54
-
55
-
56
-
57
-
58
-
59
-
60
-
61
-
62
-
63
-
64
-
65
-
66
-
67
-
68
-
69
-
70
-
71
-
72
-
73
-
74
-
75
-
76
-
77
-
78
-
79
-
80
-
81
-
82
-
83
-
84
-
85
-
86
-
87
-
88
-
89
-
90
-
91
-
92
-
93
-
94
-
95
-
96
-
97
-
98
-
99
-
100
-
101
-
102
-
103
-
104
-
105
-
106
-
 107
107 -
 108
108 -
 109
109 -
 110
110 -
 111
111 -
 112
112 -
 113
113 -
 114
114 -
 115
115 -
 116
116 -
 117
117 -
 118
118 -
 119
119 -
 120
120 -
 121
121 -
 122
122 -
 123
123 -
 124
124 -
 125
125 -
 126
126 -
 127
127 -
128
-
129
-
130
-
131
-
132
-
133
-
134
-
135
-
136
-
137
-
138
-
139
-
140
-
141
-
142
-
143
-
144
-
145
-
146
-
147
-
148
-
149
-
150
-
151
-
152
-
153
-
154
-
155
-
156
-
157
-
158
-
159
-
160
-
161
-
162
 |
 |

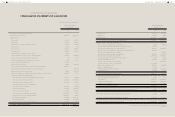
FINANCIAL INFORMATION FINANCIAL INFORMATION
230 231
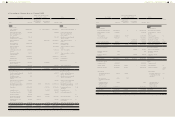
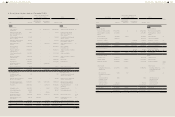
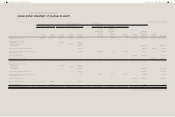
a. Reconciliation of balance sheet as of January 1, 2012
ROC GAAP
Effect of the Transition from
ROC GAAP to IFRSs IFRSs
Note
Item Amount
Measurement
or Recognition
Difference
Presentation
Difference Amount Item
Assets Assets
Current assets Current assets
Cash and cash
equivalents
$78,872,320 $- $(25,474,750) $53,397,570 Cash and cash equivalents 1)
Financial assets at fair
value through profit or
loss - current
256,868 - - 256,868 Financial assets at fair
value through profit or
loss - current
Available-for-sale
financial assets - current
736,031 - - 736,031 Available-for-sale financial
assets - current
Restricted assets -
current
63,900 - 25,474,750 25,538,650 Other financial assets -
current
1)
Note and trade
receivables, net
32,039,776 - - 32,039,776 Note and trade
receivables, net
Trade receivables -
related parties
32,977,269 - - 32,977,269 Trade receivables - related
parties
Other financial assets -
current
1,615,044 - - 1,615,044 Other receivables
Other receivables -
related parties
79,077 - - 79,077 Other receivables - related
parties
Inventories 25,389,320 - - 25,389,320 Inventories
Prepayments 6,473,372 - - 6,473,372 Prepayments
Current assets Current assets
Deferred income tax
assets - current
1,517,302 - (1,517,302) - - 2)
Other current assets 248,085 - - 248,085 Other current assets
Total current assets 180,268,364 - (1,517,302) 178,751,062 Total current assets
Non-current assets Non-current assets
Held-to-maturity financial
assets - non-current
204,597 - - 204,597 Held-to-maturity financial
assets - non-current
Available-for-sale
financial assets - non-
current
279 - - 279 Available-for-sale financial
assets - non-current
Financial assets measured
at cost - non-current
515,861 - - 515,861 Financial assets measured
at cost - non-current
Investments accounted
for using equity method
37,057,048 (593) (1,151,531) 35,904,924 Investments accounted
for using equity method
4), 11)
Properties 15,422,345 - (103,745) 15,318,600 Property, plant and
equipment
7), 8)
Intangible assets 2,120,948 - 120,593 2,241,541 Intangible assets 7)
Refundable deposits 78,894 - - 78,894 Refundable deposits
Deferred charges 120,593 - (120,593) - - 7)
Deferred income tax
assets - non-current
3,596,520 58,000 1,704,771 5,359,291 Deferred tax assets 2), 3)
Prepaid pension cost -
non-current
183,827 (82,801) - 101,026 Prepaid pension cost -
non-current
4)
Other non-current assets 8,541,647 - 103,745 8,645,392 Other non-current assets 7), 8)
Total non-current assets 67,842,559 (25,394) 553,240 68,370,405 Total non-current assets
Total $248,110,923 $(25,394) $(964,062) $247,121,467 Total
(Continued)
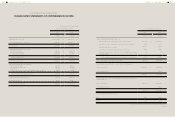
ROC GAAP
Effect of the Transition from
ROC GAAP to IFRSs IFRSs
Note
Item Amount
Measurement
or Recognition
Difference
Presentation
Difference Amount Item
Liabilities and stockholders'
equity
Liabilities and stockholders'
equity
Current liabilities Current liabilities
Note and trade payables $72,855,374 $- $- $72,855,374 Note and trade payables
Trade payables - related
parties
3,639,231 - - 3,639,231 Trade payables - related
parties
Other payables 43,422,132 99,321 - 43,521,453 Other payables 6)
Income tax payable 9,653,090 - - 9,653,090 Current tax liabilities
- - - 14,808,145 14,808,145 Provisions - current 5)
Other current liabilities 17,113,872 - (15,959,676) 1,154,196 Other current liabilities 5), 11)
Total current liabilities 146,683,699 99,321 (1,151,531) 145,631,489 Total current liabilities
Non-current liabilities Non-current liabilities
- - - 187,469 187,469 Deferred tax liabilities 2)
Guarantee deposits
received
628 - - 628 Guarantee deposits
received
Total non-current
liabilities
628 - 187,469 188,097 Total non-current
liabilities
Total liabilities 146,684,327 99,321 (964,062) 145,819,586 Total liabilities
Stockholders' equity Equity
Common stock 8,520,521 - - 8,520,521 Common stock
Capital surplus 16,619,594 (18,037) - 16,601,557 Capital surplus 9)
Retained earnings 86,616,845 (74,837) - 86,542,008 Retained earnings 3), 4),
6), 9),
10)
Other equity Other equity
Cumulative translation
adjustments
32,134 (32,134) - - Exchange differences
on translating foreign
operation
10)
Net losses not
recognized as pension
cost
(293) 293 - - - 4)
Unrealized gain on
available-for-sale
financial assets
2,939 - - 2,939 Unrealized gain on
available-for-sale
financial assets
Treasury shares (10,365,144) - - (10,365,144) Treasury shares
Total equity 101,426,596 (124,715) - 101,301,881 Total equity
Total $248,110,923 $(25,394) $(964,062) $247,121,467 Total
(Concluded)