HTC 2013 Annual Report Download - page 123
Download and view the complete annual report
Please find page 123 of the 2013 HTC annual report below. You can navigate through the pages in the report by either clicking on the pages listed below, or by using the keyword search tool below to find specific information within the annual report.-
 1
1 -
2
-
3
-
4
-
5
-
6
-
7
-
8
-
9
-
10
-
11
-
12
-
13
-
14
-
15
-
16
-
17
-
18
-
19
-
20
-
21
-
22
-
23
-
24
-
25
-
26
-
27
-
28
-
29
-
30
-
31
-
32
-
33
-
34
-
35
-
36
-
37
-
38
-
39
-
40
-
41
-
42
-
43
-
44
-
45
-
46
-
47
-
48
-
49
-
50
-
51
-
52
-
53
-
54
-
55
-
56
-
57
-
58
-
59
-
60
-
61
-
62
-
63
-
64
-
65
-
66
-
67
-
68
-
69
-
70
-
71
-
72
-
73
-
74
-
75
-
76
-
77
-
78
-
79
-
80
-
81
-
82
-
83
-
84
-
85
-
86
-
87
-
88
-
89
-
90
-
91
-
92
-
93
-
94
-
95
-
96
-
97
-
98
-
99
-
100
-
101
-
102
-
103
-
104
-
105
-
106
-
107
-
108
-
109
-
110
-
111
-
112
-
 113
113 -
 114
114 -
 115
115 -
 116
116 -
 117
117 -
 118
118 -
 119
119 -
 120
120 -
 121
121 -
 122
122 -
 123
123 -
 124
124 -
 125
125 -
 126
126 -
 127
127 -
 128
128 -
 129
129 -
 130
130 -
 131
131 -
 132
132 -
 133
133 -
134
-
135
-
136
-
137
-
138
-
139
-
140
-
141
-
142
-
143
-
144
-
145
-
146
-
147
-
148
-
149
-
150
-
151
-
152
-
153
-
154
-
155
-
156
-
157
-
158
-
159
-
160
-
161
-
162
 |
 |

FINANCIAL INFORMATION FINANCIAL INFORMATION
242 243
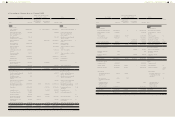
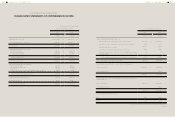
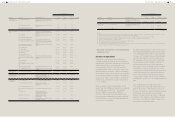
HTC CORPORATION AND SUBSIDIARIES
CONSOLIDATED STATEMENTS OF COMPREHENSIVE INCOME
(In Thousands of New Taiwan Dollars)
For the Years Ended December 31
2013 2012
Amount %Amount %
REVENUES (Notes 24 and 33)
COST OF REVENUES (Notes 14, 25 and 33)
$203,402,648
161,131,895
100
79
$289,020,175
216,089,326
100
75
GROSS PROFIT 42,270,753 21 72,930,849 25
OPERATING EXPENSES (Notes 25 and 33)
Selling and marketing
General and administrative
Research and development
26,467,742
7,230,081
12,543,452
13
4
6
32,382,563
6,227,833
15,493,139
11
2
5
Total operating expenses 46,241,275 23 54,103,535 18
OPERATING (LOSS) PROFIT (3,970,522) (2) 18,827,314 7
NON-OPERATING INCOME AND EXPENSES
Other income (Note 25)
Other gain and loss (Note 25)
Finance costs
Share of the profit or loss of associates and joint ventures (Note 16)
1,164,948
2,421,266
(8,405)
197,069
1
1
-
-
1,168,532
(923,544)
(1,715)
387,478
-
-
-
-
Total non-operating income and expenses 3,774,878 2 630,751 -
(LOSS) PROFIT BEFORE INCOME TAX
INCOME TAX (Note 26)
(195,644)
1,128,141
-
1
19,458,065
1,836,272
7
1
(LOSS) PROFIT FOR THE YEAR (1,323,785) (1) 17,621,793 6
(Continued)
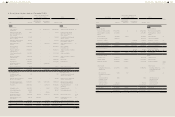
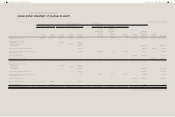
For the Years Ended December 31
2013 2012
Amount %Amount %
OTHER COMPREHENSIVE INCOME AND LOSS
Exchange differences on translating foreign operations (Note 23) $1,649,412 $1 $(1,089,693) -
Unrealized (loss) gain on available-for-sale financial assets (Note 23) (11,738) - 6,777 -
Cash flow hedge (Notes 10 and 23) (194,052) - 194,052 -
Actuarial losses arising from defined benefit plans (Note 22) (17,106) - (5,382) -
Income tax relating to the components of other comprehensive income
(Notes 22 and 26)
1,794 - 915 -
Other comprehensive income and loss for the year, net of income tax 1,428,310 1 (893,331) -
TOTAL COMPREHENSIVE INCOME FOR THE YEAR $104,525 - $16,728,462 6
ALLOCATIONS OF (LOSS) PROFIT FOR THE YEAR ATTRIBUTABLE TO
Owners of the parent $(1,323,785) (1) $16,813,575 6
Non-controlling interest - - 808,218 -
$(1,323,785) (1) $17,621,793 6
ALLOCATIONS OF TOTAL COMPREHENSIVE INCOME FOR THE YEAR
ATTRIBUTABLE TO
Owners of the parent $104,525 - $15,920,244 6
Non-controlling interest - - 808,218 -
$104,525 - $16,728,462 6
(LOSS) EARNINGS PER SHARE (Note 27)
Basic $(1.60) $20.21
Diluted $(1.60) $20.12
The accompanying notes are an integral part of the consolidated financial statements.
(Concluded)