HTC 2013 Annual Report Download - page 122
Download and view the complete annual report
Please find page 122 of the 2013 HTC annual report below. You can navigate through the pages in the report by either clicking on the pages listed below, or by using the keyword search tool below to find specific information within the annual report.-
 1
1 -
2
-
3
-
4
-
5
-
6
-
7
-
8
-
9
-
10
-
11
-
12
-
13
-
14
-
15
-
16
-
17
-
18
-
19
-
20
-
21
-
22
-
23
-
24
-
25
-
26
-
27
-
28
-
29
-
30
-
31
-
32
-
33
-
34
-
35
-
36
-
37
-
38
-
39
-
40
-
41
-
42
-
43
-
44
-
45
-
46
-
47
-
48
-
49
-
50
-
51
-
52
-
53
-
54
-
55
-
56
-
57
-
58
-
59
-
60
-
61
-
62
-
63
-
64
-
65
-
66
-
67
-
68
-
69
-
70
-
71
-
72
-
73
-
74
-
75
-
76
-
77
-
78
-
79
-
80
-
81
-
82
-
83
-
84
-
85
-
86
-
87
-
88
-
89
-
90
-
91
-
92
-
93
-
94
-
95
-
96
-
97
-
98
-
99
-
100
-
101
-
102
-
103
-
104
-
105
-
106
-
107
-
108
-
109
-
110
-
111
-
 112
112 -
 113
113 -
 114
114 -
 115
115 -
 116
116 -
 117
117 -
 118
118 -
 119
119 -
 120
120 -
 121
121 -
 122
122 -
 123
123 -
 124
124 -
 125
125 -
 126
126 -
 127
127 -
 128
128 -
 129
129 -
 130
130 -
 131
131 -
 132
132 -
133
-
134
-
135
-
136
-
137
-
138
-
139
-
140
-
141
-
142
-
143
-
144
-
145
-
146
-
147
-
148
-
149
-
150
-
151
-
152
-
153
-
154
-
155
-
156
-
157
-
158
-
159
-
160
-
161
-
162
 |
 |

FINANCIAL INFORMATION FINANCIAL INFORMATION
240 241
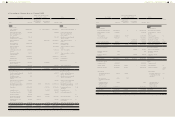
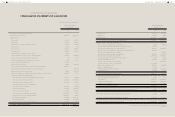
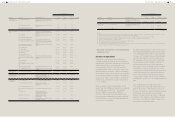
HTC CORPORATION AND SUBSIDIARIES
CONSOLIDATED BALANCE SHEETS
(In Thousands of New Taiwan Dollars)
ASSETS
December 31, 2013 December 31, 2012 January 1, 2012
Amount %Amount %Amount %
CURRENT ASSETS
Cash and cash equivalents (Note 6) $53,298,941 31 $50,966,143 25 $62,026,758 24
Financial assets at fair value through profit or
loss - current (Notes 7 and 32)
162,297 - 6,950 - 256,868 -
Available-for-sale financial assets - current
(Notes 8 and 32)
- - 37,902 - 736,031 -
Held-to-maturity financial assets - current
(Notes 9 and 32)
- - 101,459 - - -
Derivative financial assets for hedging -
current (Notes 10 and 32)
- - 204,519 - - -
Note and trade receivables, net (Notes 13 and
33)
23,371,172 14 41,253,826 20 64,719,791 25
Other receivables (Note 13) 2,137,653 1 1,524,269 1 1,947,665 1
Other receivables - related parties (Notes 13
and 33)
- - 6,600,093 3 966 -
Current tax assets (Note 26) 238,085 - 61,532 - 263,116 -
Inventories (Note 14) 23,599,558 14 23,809,377 12 28,430,590 11
Prepayments (Note 15) 5,803,744 3 4,965,814 2 6,507,516 3
Other current financial assets (Notes 6, 12
and 34)
2,771,023 2 6,561,444 3 25,543,450 10
Other current assets 124,808 - 39,097 - 249,644 -
Total current assets 111,507,281 65 136,132,425 66 190,682,395 74
NON-CURRENT ASSETS
Available-for-sale financial assets - non-
current (Notes 8 and 32)
239 - 197 - 279 -
Held-to-maturity financial assets - non-
current (Notes 9 and 32)
- - - - 204,597 -
Financial assets measured at cost - non-
current (Notes 11 and 32)
4,603,061 2 4,304,907 2 3,408,654 1
Investments accounted for using equity
method (Notes 16 and 33)
227,504 - 5,892,168 3 71,732 -
Property, plant and equipment (Notes 17 and
33)
25,561,399 15 25,990,766 12 21,715,633 9
Intangible assets (Note 18) 8,664,066 5 11,683,170 6 22,767,479 9
Deferred tax assets (Note 26) 8,665,235 5 8,689,842 4 6,319,978 3
Refundable deposits (Note 32) 352,894 - 190,142 - 185,306 -
Long-term receivables (Notes 13 and 30) 1,182,393 1 4,369,350 2 - -
Prepaid pension cost - non-current (Note 22) 125,715 - 119,273 - 100,651 -
Other non-current assets (Note 15) 11,739,400 7 9,876,752 5 10,655,126 4
Total non-current assets 61,121,906 35 71,116,567 34 65,429,435 26
TOTAL $172,629,187 100 $207,248,992 100 $256,111,830 100
(Continued)
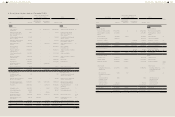
LIABILITIES AND EQUITY
December 31, 2013 December 31, 2012 January 1, 2012
Amount %Amount %Amount %
CURRENT LIABILITIES
Note and trade payables (Notes 19 and 33) $46,275,851 27 $73,618,197 36 $78,473,130 31
Other payables (Notes 20 and 33) 38,032,999 22 39,267,173 19 47,595,791 18
Current tax liabilities (Note 26) 1,040,128 1 2,713,373 1 10,570,682 4
Provisions - current (Note 21) 8,208,885 5 8,881,514 4 15,133,275 6
Other current liabilities (Note 20) 956,127 - 1,788,106 1 1,661,140 1
Total current liabilities 94,513,990 55 126,268,363 61 153,434,018 60
NON-CURRENT LIABILITIES
Deferred tax liabilities (Note 26) 151,122 - 647,936 - 340,261 -
Guarantee deposits received (Note 32) 256,415 - 59,999 - 42,946 -
Total non-current liabilities 407,537 - 707,935 - 383,207 -
Total liabilities 94,921,527 55 126,976,298 61 153,817,225 60
EQUITY ATTRIBUTABLE TO OWNERS OF THE
PARENT (Note 23)
Share capital - common stock 8,423,505 5 8,520,521 4 8,520,521 3
Capital surplus 15,360,307 9 16,601,557 8 16,601,557 7
Retained earnings
Legal reserve 18,149,350 11 16,471,254 8 10,273,674 4
Special reserve 854,138 - - - 580,856 -
Accumulated earnings 47,282,820 27 53,630,777 26 75,687,478 30
Total retained earnings 66,286,308 38 70,102,031 34 86,542,008 34
Other equity 557,698 - (885,925) - 2,939 -
Treasury shares (12,920,158) (7) (14,065,490) (7) (10,365,144) (4)
Total equity attributable to owners of
the parent
77,707,660 45 80,272,694 39 101,301,881 40
NON-CONTROLLING INTEREST - - - - 992,724 -
Total equity 77,707,660 45 80,272,694 39 102,294,605 40
TOTAL $172,629,187 100 $207,248,992 100 $256,111,830 100
The accompanying notes are an integral part of the consolidated financial statements.
(Concluded)