HTC 2013 Annual Report Download - page 20
Download and view the complete annual report
Please find page 20 of the 2013 HTC annual report below. You can navigate through the pages in the report by either clicking on the pages listed below, or by using the keyword search tool below to find specific information within the annual report.-
 1
1 -
2
-
3
-
4
-
5
-
6
-
7
-
8
-
9
-
 10
10 -
 11
11 -
 12
12 -
 13
13 -
 14
14 -
 15
15 -
 16
16 -
 17
17 -
 18
18 -
 19
19 -
 20
20 -
 21
21 -
 22
22 -
 23
23 -
 24
24 -
 25
25 -
 26
26 -
 27
27 -
 28
28 -
 29
29 -
 30
30 -
31
-
32
-
33
-
34
-
35
-
36
-
37
-
38
-
39
-
40
-
41
-
42
-
43
-
44
-
45
-
46
-
47
-
48
-
49
-
50
-
51
-
52
-
53
-
54
-
55
-
56
-
57
-
58
-
59
-
60
-
61
-
62
-
63
-
64
-
65
-
66
-
67
-
68
-
69
-
70
-
71
-
72
-
73
-
74
-
75
-
76
-
77
-
78
-
79
-
80
-
81
-
82
-
83
-
84
-
85
-
86
-
87
-
88
-
89
-
90
-
91
-
92
-
93
-
94
-
95
-
96
-
97
-
98
-
99
-
100
-
101
-
102
-
103
-
104
-
105
-
106
-
107
-
108
-
109
-
110
-
111
-
112
-
113
-
114
-
115
-
116
-
117
-
118
-
119
-
120
-
121
-
122
-
123
-
124
-
125
-
126
-
127
-
128
-
129
-
130
-
131
-
132
-
133
-
134
-
135
-
136
-
137
-
138
-
139
-
140
-
141
-
142
-
143
-
144
-
145
-
146
-
147
-
148
-
149
-
150
-
151
-
152
-
153
-
154
-
155
-
156
-
157
-
158
-
159
-
160
-
161
-
162
 |
 |

BUSINESS OPERATIONS BUSINESS OPERATIONS
36 37
BUSINESS OPERATIONS
Industry Overview
With world leaders and Oscar winners all embracing the“selfie"– a photograph taken of yourself using a
smartphone – the age of the smartphone is cemented in our popular culture. The mobile platform is now
the main driver behind growth in semi-conductor firms, social networks, content providers and applications.
Smartphone penetration globally now stands at 22% (eMarketer) and 2013 marked the first year that
smartphone volume passed 1bn, growing 39.2% over 2012 sales volume (IDC). Gartner reported that 195m
tablets were sold in 2013, which was 68% growth from 2012 sales of 116m. Adding in 53.9m wearable devices
globally that were sold across all formats (ABI Research), the market for connected devices is both diverse
and evolving. It is estimated that the number of connected devices in the world will exceed its population in
2014 and rise to 1.4 per capita in 2018 so even though some markets are maturing in terms of smartphone
sales, the excitement and innovation in the mobile device category is set to continue.
Across the world there are 800 mobile carriers, of which approximately 500 support smartphones and this
is one of the prime drivers for smartphone adoption. Speed and reliability of connectivity greatly enhances
the consumer experience and so determines the repertoire of smartphone usage they enjoy. Smartphones
are 21% of all mobile devices but they produce 88% of all data traffic which is 29 times higher than a non-
smart device. At the top of the curve are 4G enabled devices which are 2.9% of all connections but generate
30% of all mobile data traffic. A 4G device generates 14.5 times more traffic than a non 4G device (Cisco
VNI report 2014) – which is why the mobile operators are fiercely innovating price plans and retention
schemes to attract these vary valuable users to their networks.
At a market level, China remains the world's largest market but growth rates slowed for the first time
in 2013 as the market reached the late majority stage of adoption. 353.9m shipped putting the market
penetration at 62.6%, slowing to a growth rate of 86.5% year on year (Canalys). However, with China Mobile,
the world's biggest operator planning an aggressive 4G roll-out in 2014 and mobile being the dominant
way to connect to the internet, the market demand will remain buoyant. In the US, the smartphone market
is now at 56% penetration, up from 35% 2 years ago (based on Pew Research figures.) In the 18 – 34 age
bracket the penetration rate is 80%. Only 9% of the US population don't own a cellphone. In EMEA region
(Europe, Middle East and Africa), shipments in 2013 were 253.1m, up by 26.1%. As markets mature, the lower
penetrated markets like Russia will see the fastest growth rates.
Smartphones themselves continued the trend towards bigger, higher quality screens and more powerful
processing power – responding to the ever increasing consumer appetite not only to be connected but to be
actively consuming data and content. In 2012, the average smartphone consumed 353MB of data per month –
in 2013 it was 529MB of data per month. The network performance greatly helped as connection speeds more
than doubled in 2013 delighting consumers with the responsiveness and reliability of their service.
More consumers are therefore opting into plans that allow for much more usage – either through unlimited
packages or the inventive shared plans typical of the highly competitive US market. In 2010, the top 1%
smartphone users created 52% of the mobile traffic – this was down to 10% as more users increased their
data usage. Mobile Video is another big driver of smartphone usage – now up to 53% of all mobile data
traffic, having breached the 50% level in 2012. With bigger screens enabling top quality viewing and
application usage, it is unsurprising that the percentage of smartphones with screens larger than 4.5 inches
went from 20% in Q1 2013 to 38% in Q4 2013 globally (GFK). Asia in particular likes the “phablet" format –
with 45% of their phones over 4.5 inches and an enormous 24% over 5 inches.
As the functionality of phones extends beyond a range of services, utilities and applications, the consumer is
becoming even more discerning in the quality of the technology and performance. User experience, content
management and ability to connect to other devices are all becoming more widely understood as being key
criteria to assess a product – not just the industrial design, the operating system and the ecosystem. When
asked what the top brand purchase criteria were to consumers across the world, the top ten answers were:
(Hall & Partners, Mobile Brand Tracker Research 2013)
1. Well designed
2. Reliable
3. Make Beautiful phones
4. Easy to personalize
5. Fast web Browsing
6. Feels good in my hand
7. Enjoyable Social Networking
8. Wide range of accessories
9. High Quality Screen
10. Best Quality for watching videos
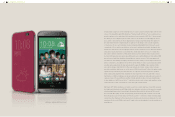
Design features very prominently in the qualities that consumers look for in a brand and product experience.
This notably includes one-hand usability and a robustness that can deal with the wear and tear of being
picked up over 150 times a day for an average user.
Passion points are becoming more prominent in the range of trendsetting applications and social networks that
work most practically over a mobile device. Camera quality for both still photography and video capture is now
very high on the consumers' shopping list. This stretches way beyond the specification benchmarks like mega-
pixels to camera modes, photo editing, visual effects, focus treatments and sharing capabilities.