HTC 2013 Annual Report Download - page 105
Download and view the complete annual report
Please find page 105 of the 2013 HTC annual report below. You can navigate through the pages in the report by either clicking on the pages listed below, or by using the keyword search tool below to find specific information within the annual report.-
 1
1 -
2
-
3
-
4
-
5
-
6
-
7
-
8
-
9
-
10
-
11
-
12
-
13
-
14
-
15
-
16
-
17
-
18
-
19
-
20
-
21
-
22
-
23
-
24
-
25
-
26
-
27
-
28
-
29
-
30
-
31
-
32
-
33
-
34
-
35
-
36
-
37
-
38
-
39
-
40
-
41
-
42
-
43
-
44
-
45
-
46
-
47
-
48
-
49
-
50
-
51
-
52
-
53
-
54
-
55
-
56
-
57
-
58
-
59
-
60
-
61
-
62
-
63
-
64
-
65
-
66
-
67
-
68
-
69
-
70
-
71
-
72
-
73
-
74
-
75
-
76
-
77
-
78
-
79
-
80
-
81
-
82
-
83
-
84
-
85
-
86
-
87
-
88
-
89
-
90
-
91
-
92
-
93
-
94
-
 95
95 -
 96
96 -
 97
97 -
 98
98 -
 99
99 -
 100
100 -
 101
101 -
 102
102 -
 103
103 -
 104
104 -
 105
105 -
 106
106 -
 107
107 -
 108
108 -
 109
109 -
 110
110 -
 111
111 -
 112
112 -
 113
113 -
 114
114 -
 115
115 -
116
-
117
-
118
-
119
-
120
-
121
-
122
-
123
-
124
-
125
-
126
-
127
-
128
-
129
-
130
-
131
-
132
-
133
-
134
-
135
-
136
-
137
-
138
-
139
-
140
-
141
-
142
-
143
-
144
-
145
-
146
-
147
-
148
-
149
-
150
-
151
-
152
-
153
-
154
-
155
-
156
-
157
-
158
-
159
-
160
-
161
-
162
 |
 |

FINANCIAL INFORMATION FINANCIAL INFORMATION
206 207
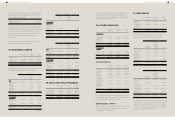
At the end of the reporting period, the proportion
of ownership and voting rights in subsidiaries held
by the Company were as follows:
December 31,
2013
December 31,
2012
January 1,
2012
H.T.C. (B.V.I.)
Corp.
100.00% 100.00% 100.00%
Communication
Global
Certification Inc.
100.00% 100.00% 100.00%
High Tech
Computer Asia
Pacific Pte. Ltd.
100.00% 100.00% 100.00%
HTC Investment
Corporation
100.00% 100.00% 100.00%
PT. High Tech
Computer
Indonesia
1.00% 1.00% 1.00%
HTC I
Investment
Corporation
100.00% 100.00% 100.00%
HTC Holding
Cooperatief
U.A.
0.01% 0.01% 0.01%
Huada Digital
Corporation
50.00% 50.00% 50.00%
HTC Investment
One (BVI)
Corporation
100.00% 100.00% 100.00%
FunStream
Corporation
- 100.00% -
Refer to Note 29 to the consolidated financial
statements for the year ended December 31, 2013
for the disclosures of the Company's acquisitions of
FunStream Corporation. Refer to Note 4 for the details
of the subsidiaries indirectly held by the Company.
The Company and its subsidiary, High Tech Computer
Asia Pacific Pte. Ltd., acquired equity interests of 1%
and 99%, respectively, in PT. High Tech Computer
Indonesia and acquired equity interests of 0.01% and
99.99%, respectively, in HTC Holding Cooperatief U.A.
As a result, PT. High Tech Computer Indonesia and HTC
Holding Cooperatief U.A. are considered as subsidiaries
of the Company.
In 2012, the Company determined that the recoverable
amount of investment in FunStream Corporation was
less than its carrying amount and thus recognized an
impairment loss of NT$45,017 thousand. FunStream
Corporation was dissolved in June 2013.
The share of net income or loss and other
comprehensive income from subsidiaries under
equity method were accounted for based on the
audited financial statements.
Investments in Jointly Controlled Entity
December 31,
2013
December 31,
2012
January 1,
2012
Unlisted
companies
Huada Digital
Corporation
$227,504 $241,309 $-
The percentage of ownership and voting rights
held by the Company at the end of reporting
period were as follows:
Company Name
December 31,
2013
December 31,
2012
January 1,
2012
Huada Digital
Corporation
50.00% 50.00% 50.00%
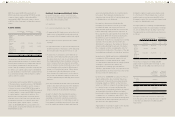
In December 2009, the Company acquired
100% equity interest in Huada, whose main
business is software services, for NT$245,000
thousand and accounted for this investment
by the equity method. In September 2011, the
Company increased its investment by NT$5,000
thousand. As of December 31, 2012, the
Company's investment in Huada had amounted
to NT$250,000 thousand. In September 2011, the
Fair Trade Commission approved an investment by
Chunghwa Telecom Co., Ltd. ("CHT") in Huada and
the registration of this investment was completed
in October 2011. After CHT's investment, the
Company's ownership percentage declined
from 100% to 50%. In March 2012, Huada held a
stockholders' meeting and re-elected its directors
and supervisors. As a result, the investment type
was changed to joint venture and the Company
continued to account for this investment by the
equity method.
The investments in jointly controlled entity and
the share of net income and other comprehensive
income from investments are accounted for based
on the audited financial statements.
17. PROPERTY, PLANT AND EQUIPMENT
December 31, 2013 December 31, 2012 January 1, 2012
Carrying amounts
Land
Buildings
Property in construction
Machinery and equipment
Other equipment
$7,462,489
8,245,062
-
3,529,270
536,787
$7,462,489
8,330,607
-
3,573,566
360,174
$7,462,281
2,742,684
1,923,875
2,887,919
301,841
$19,773,608 $19,726,836 $15,318,600
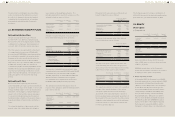
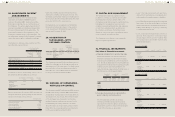
Movement of property, plant and equipment for the years ended December 31, 2013 and 2012 were as follows:
2013
Land Buildings Property in
Construction
Machinery and
Equipment
Other
Equipment Total
Cost
Balance, beginning of the year
Additions
Disposal
Reclassification
Transfer to expense
$7,462,489
-
-
-
-
$9,520,993
270,787
(5,995)
18,726
-
$-
1,581
-
-
(1,581)
$8,732,565
1,069,092
(56,518)
(1,664)
-
$969,180
309,839
(64,456)
(17,062)
-
$26,685,227
1,651,299
(126,969)
-
(1,581)
Balance, end of the year 7,462,489 9,804,511 - 9,743,475 1,197,501 28,207,976
Accumulated depreciation
Balance, beginning of the year
Depreciation expenses
Disposal
Reclassification
-
-
-
-
1,190,386
356,332
(5,995)
18,726
-
-
-
-
5,158,999
1,113,388
(56,518)
(1,664)
609,006
133,226
(64,456)
(17,062)
6,958,391
1,602,946
(126,969)
-
Balance, end of the year - 1,559,449 - 6,214,205 660,714 8,434,368
Net book value, end of the year $7,462,489 $8,245,062 $- $3,529,270 $536,787 $19,773,608
2012
Land Buildings Property in
Construction
Machinery and
Equipment
Other
Equipment Total
Cost
Balance, beginning of the year
Additions
Disposal
Transfer to expense
Reclassification
$7,462,281
208
-
-
-
$3,680,608
224,427
-
-
5,615,958
$1,923,875
3,916,746
-
(5,912)
(5,834,709)
$7,272,704
1,632,493
(172,632)
-
-
$829,193
151,859
(11,987)
-
115
$21,168,661
5,925,733
(184,619)
(5,912)
(218,636)
Balance, end of the year 7,462,489 9,520,993 - 8,732,565 969,180 26,685,227
Accumulated depreciation
Balance, beginning of the year
Depreciation expenses
Disposal
-
-
-
937,924
252,462
-
-
-
-
4,384,785
946,846
(172,632)
527,352
93,641
(11,987)
5,850,061
1,292,949
(184,619)
Balance, end of the year - 1,190,386 - 5,158,999 609,006 6,958,391
Net book value, end of the year $7,462,489 $8,330,607 $- $3,573,566 $360,174 $19,726,836