HTC 2013 Annual Report Download - page 155
Download and view the complete annual report
Please find page 155 of the 2013 HTC annual report below. You can navigate through the pages in the report by either clicking on the pages listed below, or by using the keyword search tool below to find specific information within the annual report.-
 1
1 -
2
-
3
-
4
-
5
-
6
-
7
-
8
-
9
-
10
-
11
-
12
-
13
-
14
-
15
-
16
-
17
-
18
-
19
-
20
-
21
-
22
-
23
-
24
-
25
-
26
-
27
-
28
-
29
-
30
-
31
-
32
-
33
-
34
-
35
-
36
-
37
-
38
-
39
-
40
-
41
-
42
-
43
-
44
-
45
-
46
-
47
-
48
-
49
-
50
-
51
-
52
-
53
-
54
-
55
-
56
-
57
-
58
-
59
-
60
-
61
-
62
-
63
-
64
-
65
-
66
-
67
-
68
-
69
-
70
-
71
-
72
-
73
-
74
-
75
-
76
-
77
-
78
-
79
-
80
-
81
-
82
-
83
-
84
-
85
-
86
-
87
-
88
-
89
-
90
-
91
-
92
-
93
-
94
-
95
-
96
-
97
-
98
-
99
-
100
-
101
-
102
-
103
-
104
-
105
-
106
-
107
-
108
-
109
-
110
-
111
-
112
-
113
-
114
-
115
-
116
-
117
-
118
-
119
-
120
-
121
-
122
-
123
-
124
-
125
-
126
-
127
-
128
-
129
-
130
-
131
-
132
-
133
-
134
-
135
-
136
-
137
-
138
-
139
-
140
-
141
-
142
-
143
-
144
-
 145
145 -
 146
146 -
 147
147 -
 148
148 -
 149
149 -
 150
150 -
 151
151 -
 152
152 -
 153
153 -
 154
154 -
 155
155 -
 156
156 -
 157
157 -
 158
158 -
 159
159 -
 160
160 -
 161
161 -
 162
162
 |
 |

FINANCIAL INFORMATION FINANCIAL INFORMATION
306 307
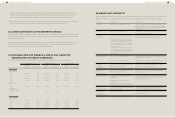
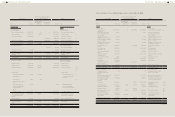
2) Reconciliation of consolidated balance sheet as of December 31, 2012
ROC GAAP
Effect of the Transition from
ROC GAAP to IFRSs IFRSs
Note
Item Amount
Measurement
or Recognition
Difference
Presentation
Difference Amount Item
Assets Assets
Current assets Current assets
Cash and cash
equivalents
$53,878,067 $- $(2,911,924) $50,966,143 Cash and cash equivalents a)
Financial assets at fair
value through profit or
loss - current
6,950 - - 6,950 Financial assets at fair
value through profit or
loss - current
Available-for-sale
financial assets - current
37,902 - - 37,902 Available-for-sale financial
assets - current
Held-to-maturity financial
assets - current
101,459 - - 101,459 Held-to-maturity financial
assets - current
Derivative financial assets
for hedging - current
204,519 - - 204,519 Derivative financial assets
for hedging - current
Restricted assets -
current
3,649,520 - 2,911,924 6,561,444 Other current financial
assets
a)
Note and trade
receivables, net
41,253,826 - - 41,253,826 Note and trade
receivables, net
Other current financial
assets
1,524,269 - - 1,524,269 Other receivables
Other receivables -
related parties
6,600,093 - - 6,600,093 Other receivables - related
parties
Income tax receivables 61,532 - - 61,532 Current tax assets
Inventories 23,809,377 - - 23,809,377 Inventories
Prepayments 4,965,814 - - 4,965,814 Prepayments
Deferred income tax
assets - current
3,530,215 - (3,530,215) - - b)
Other current assets 39,097 - - 39,097 Other current assets
Total current assets 139,662,640 - (3,530,215) 136,132,425 Total current assets
Non-current assets Non-current assets
Available-for-sale
financial assets - non-
current
197 - - 197 Available-for-sale financial
assets - non-current
Financial assets measured
at cost - non-current
4,304,907 - - 4,304,907 Financial assets measured
at cost - non-current
Investments accounted
for using the equity
method
5,892,168 - - 5,892,168 Investments accounted for
using the equity method
Properties 25,651,292 - 339,474 25,990,766 Property, plant and
equipment
g), h)
Intangible assets 11,520,674 (269) 162,765 11,683,170 Intangible assets d), g)
Refundable deposits 190,142 - - 190,142 Refundable deposits
Deferred charges 897,164 - (897,164) - - g)
Deferred income assets
tax - non-current
4,427,776 83,915 4,178,151 8,689,842 Deferred tax assets b), c),
d)
Long-term receivables 4,369,350 - - 4,369,350 Long-term receivables
Prepaid pension cost -
non-current
205,989 (86,716) - 119,273 Prepaid pension cost -
non-current
d)
Other non-current assets 9,481,827 394,925 9,876,752 Other non-current assets g), h)
Total non-current assets 66,941,486 (3,070) 4,178,151 71,116,567 Total non-current assets
Total $206,604,126 $(3,070) $647,936 $207,248,992 Total
(Continued)
ROC GAAP
Effect of the Transition from
ROC GAAP to IFRSs IFRSs
Note
Item Amount
Measurement
or Recognition
Difference
Presentation
Difference Amount Item
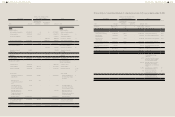
Liabilities and
stockholders' equity
Liabilities and stockholders'
equity
Current liabilities Current liabilities
Note and trade payables $78,473,130 $- $- $78,473,130 Note and trade payables
Other payables 47,496,470 99,321 - 47,595,791 Other payables f)
Income tax payables 10,570,682 - - 10,570,682 Current tax liabilities
- - - 15,133,275 15,133,275 Provisions - current e)
Other current liabilities 16,794,415 - (15,133,275) 1,661,140 Other current liabilities e)
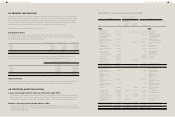
Total current liabilities 153,334,697 99,321 - 153,434,018 Total current liabilities
Non-current liabilities Non-current liabilities
- - - 340,261 340,261 Deferred tax liabilities b)
Guarantee deposits
received
42,946 - - 42,946 Guarantee deposits
received
Total non-current
liabilities
42,946 - 340,261 383,207 Total non-current
liabilities
Total liabilities 153,377,643 99,321 340,261 153,817,225 Total liabilities
Stockholders' equity Equity attributable to
owners of the parent
Common stock 8,520,521 - - 8,520,521 Common stock
Capital surplus 16,619,594 (18,037) - 16,601,557 Capital surplus i)
Retained earnings 86,616,845 (74,837) - 86,542,008 Retained earnings c), d),
f), i),
j)
Other equity Other equity
Cumulative translation
adjustments
32,134 (32,134) - - Exchange differences
on translating foreign
operation
j)
Net losses not
recognized as pension
cost
(293) 293 - - - d)
Unrealized gains or
losses from available-
for-sale financial
assets
2,939 - - 2,939 Unrealized gains or
losses from available-
for-sale financial assets
Treasury shares (10,365,144) - - (10,365,144) Treasury shares
Total equity attributable
to stockholders of the
parent
101,426,596 (124,715) - 101,301,881 Total equity attributable
to owners of the parent
Minority interest 992,724 - - 992,724 Non-controlling interest
Total stockholders'
equity
102,419,320 (124,715) - 102,294,605 Total equity
Total $255,796,963 $(25,394) $340,261 $256,111,830 Total
(Concluded)