HTC 2013 Annual Report Download - page 147
Download and view the complete annual report
Please find page 147 of the 2013 HTC annual report below. You can navigate through the pages in the report by either clicking on the pages listed below, or by using the keyword search tool below to find specific information within the annual report.-
 1
1 -
2
-
3
-
4
-
5
-
6
-
7
-
8
-
9
-
10
-
11
-
12
-
13
-
14
-
15
-
16
-
17
-
18
-
19
-
20
-
21
-
22
-
23
-
24
-
25
-
26
-
27
-
28
-
29
-
30
-
31
-
32
-
33
-
34
-
35
-
36
-
37
-
38
-
39
-
40
-
41
-
42
-
43
-
44
-
45
-
46
-
47
-
48
-
49
-
50
-
51
-
52
-
53
-
54
-
55
-
56
-
57
-
58
-
59
-
60
-
61
-
62
-
63
-
64
-
65
-
66
-
67
-
68
-
69
-
70
-
71
-
72
-
73
-
74
-
75
-
76
-
77
-
78
-
79
-
80
-
81
-
82
-
83
-
84
-
85
-
86
-
87
-
88
-
89
-
90
-
91
-
92
-
93
-
94
-
95
-
96
-
97
-
98
-
99
-
100
-
101
-
102
-
103
-
104
-
105
-
106
-
107
-
108
-
109
-
110
-
111
-
112
-
113
-
114
-
115
-
116
-
117
-
118
-
119
-
120
-
121
-
122
-
123
-
124
-
125
-
126
-
127
-
128
-
129
-
130
-
131
-
132
-
133
-
134
-
135
-
136
-
 137
137 -
 138
138 -
 139
139 -
 140
140 -
 141
141 -
 142
142 -
 143
143 -
 144
144 -
 145
145 -
 146
146 -
 147
147 -
 148
148 -
 149
149 -
 150
150 -
 151
151 -
 152
152 -
 153
153 -
 154
154 -
 155
155 -
 156
156 -
 157
157 -
158
-
159
-
160
-
161
-
162
 |
 |

FINANCIAL INFORMATION FINANCIAL INFORMATION
290 291
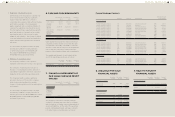
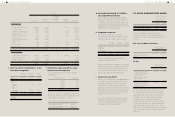
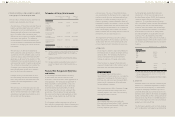
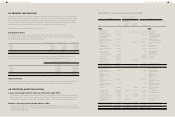
g. Unrecognized deferred tax liabilities
associated with investments
As of December 31, 2013, December 31, 2012
and January 1, 2012, the unrecognized deferred
tax liability for all taxable temporary differences
associated with investments in subsidiaries were
NT$559,255 thousand, NT$297,402 thousand and
NT$588,125 thousand, respectively.
h. Integrated income tax
The imputation credit account ("ICA")
information as of December 31, 2013, December
31, 2012 and January 1, 2012, were as follows:
December
31, 2013
December
31, 2012
January 1,
2012
Unappropriated
earnings
generated
on and after
January 1, 1998
$47,282,820 $53,630,777 $75,687,478
Balance of ICA $6,573,169 $5,966,033 $2,523,575
The actual creditable ratio for distribution of
earnings of 2012 was 13.47%.
Under Income Tax Act, for distribution of earnings
generated after January 1, 1998, the ratio for the
imputation credits allocated to shareholders of
the Company was based on the balance of the
ICA as of the date of dividend distribution.
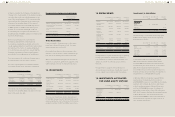
i. Income tax assessments
HTC's income tax returns through 2010 had been
assessed by the tax authorities. However, HTC
disagreed with the tax authorities' assessment
on its returns for unappropriated earnings of
2009 and applied for the administrative remedial.
Nevertheless, under the conservatism guideline,
HTC adjusted its income tax for the tax shortfall
stated in the tax assessment notices.
The income tax returns of CGC, HTC Investment
Corporation and HTC I Investment Corporation
for the years through 2011 have been assessed
and approved by the tax authorities.
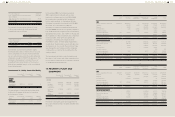
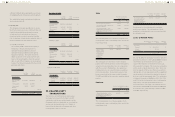
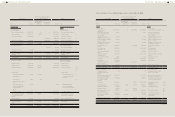
e. Items for which no deferred tax assets
have been recognized
December
31, 2013
December
31, 2012
January 1,
2012
Loss
carryforward
$553,280 $95,455 $98,419
Investment
credits
Purchase of
machinery
and
equipment
$- $- $317
Research and
development
- 981,627 3,123,277
$- $981,627 $3,123,594
Deductible
temporary
differences
$4,587,454 $5,341,763 $7,823,676
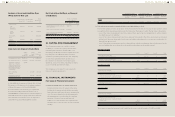
27. (LOSS) EARNINGS PER SHARE
Unit: NT$ Per Share
For the Year Ended
December 31
2013 2012
Basic (loss) earnings per share $(1.60) $20.21
Diluted (loss) earnings per share $(1.60) $20.12
The (loss) earnings and weighted average
number of ordinary shares outstanding for the
computation of (loss) earnings per share were as
follows:
Net (Loss) Profit for the Years
For the Year Ended
December 31
2013 2012
(Loss) profit for the year
attributable to owners of the
parent
$( 1,323,785) $ 16,813,575
Shares
For the Year Ended
December 31
2013 2012
Weighted average number
of ordinary shares used in
computation of basic (loss)
earnings per share
829,082 831,980
Effect of dilutive potential
ordinary shares:
Bonus issue to employees - 3,748
Weighted average number of
ordinary shares used in the
computation of diluted (loss)
earnings per share
829,082 835,728
If the Company might settle the bonuses paid
to employees by cash or shares, the Company
presumed that the entire amount of the bonus
would be settled in shares and the resulting
potential shares should be included in the
weighted average number of outstanding shares
used in the computation of diluted earnings per
share, if the shares had a dilutive effect. Such
dilutive effect of the potential shares was included
in the computation of diluted earnings per share
until the
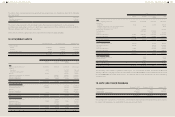
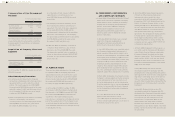
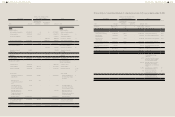
f. Information about unused loss carry-
forward and tax-exemption
Loss carryforwards as of December 31, 2013
comprised of:
Remaining Carrying Expiry Year
$65,915 2014
104,266 2015
2,447,376 2018
7,668,179 2023
130,169 2033
$10,415,905
Under the Statute for Upgrading Industries,
the Company was granted exemption from
corporate income tax for as follows:
Item Exempt from Corporate Income Tax Expiry Year
Sales of wireless and smartphone which
has 3.5G and GPS function
2010.01.01-
2014.12.31
Sales of wireless and smartphone which
has 3.5G and GPS function
2015.01.01-
2018.09.30
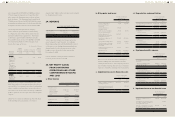
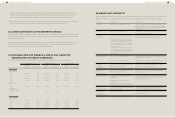
2012
Opening Balance
Recognized in
Profit or Loss
Recognized
in Other
Comprehensive
Income
Translation
Adjustment Closing Balance
Deferred tax assets
Temporary differences
Unrealized marketing expenses $2,279,832 $67,928 $- $(11,291) $2,336,469
Unrealized royalties 1,981,614 1,004,270 - - 2,985,884
Unrealized warranty expense 920,517 (59,157) - (1,507) 859,853
Allowance for loss on decline in
value of inventory
510,613 219,792 - 26,057 756,462
Unrealized salary and welfare 233,111 92,109 - 32,102 357,322
Unrealized profit 173,146 192,378 - - 365,524
Unrealized contingent losses on
purchase orders
135,490 (64,711) - - 70,779
Others 76,818 167,660 915 48,625 294,018
Loss carryforwards 7,404 (6,793) - (127) 484
Investment credits 1,433 661,614 - - 663,047
$6,319,978 $2,275,090 $915 $93,859 $8,689,842
Deferred tax liabilities
Temporary differences
Unrealized gain on investments $240,760 $234,852 $- $(4,869) $470,743
Financial assets at FVTPL 43,668 (40,707) - - 2,961
Defined benefit plans 31,276 3,758 - - 35,034
Others 24,557 116,477 - (1,836) 139,198
$340,261 $314,380 $- $(6,705) $647,936