HTC 2013 Annual Report Download - page 90
Download and view the complete annual report
Please find page 90 of the 2013 HTC annual report below. You can navigate through the pages in the report by either clicking on the pages listed below, or by using the keyword search tool below to find specific information within the annual report.-
 1
1 -
2
-
3
-
4
-
5
-
6
-
7
-
8
-
9
-
10
-
11
-
12
-
13
-
14
-
15
-
16
-
17
-
18
-
19
-
20
-
21
-
22
-
23
-
24
-
25
-
26
-
27
-
28
-
29
-
30
-
31
-
32
-
33
-
34
-
35
-
36
-
37
-
38
-
39
-
40
-
41
-
42
-
43
-
44
-
45
-
46
-
47
-
48
-
49
-
50
-
51
-
52
-
53
-
54
-
55
-
56
-
57
-
58
-
59
-
60
-
61
-
62
-
63
-
64
-
65
-
66
-
67
-
68
-
69
-
70
-
71
-
72
-
73
-
74
-
75
-
76
-
77
-
78
-
79
-
 80
80 -
 81
81 -
 82
82 -
 83
83 -
 84
84 -
 85
85 -
 86
86 -
 87
87 -
 88
88 -
 89
89 -
 90
90 -
 91
91 -
 92
92 -
 93
93 -
 94
94 -
 95
95 -
 96
96 -
 97
97 -
 98
98 -
 99
99 -
 100
100 -
101
-
102
-
103
-
104
-
105
-
106
-
107
-
108
-
109
-
110
-
111
-
112
-
113
-
114
-
115
-
116
-
117
-
118
-
119
-
120
-
121
-
122
-
123
-
124
-
125
-
126
-
127
-
128
-
129
-
130
-
131
-
132
-
133
-
134
-
135
-
136
-
137
-
138
-
139
-
140
-
141
-
142
-
143
-
144
-
145
-
146
-
147
-
148
-
149
-
150
-
151
-
152
-
153
-
154
-
155
-
156
-
157
-
158
-
159
-
160
-
161
-
162
 |
 |

FINANCIAL INFORMATION FINANCIAL INFORMATION
176 177
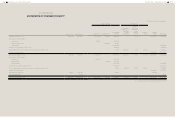
HTC CORPORATION
STATEMENTS OF COMPREHENSIVE INCOME
(In Thousands of New Taiwan Dollars)
For the Years Ended December 31
2013 2012
Amount %Amount %
REVENUES (Notes 24 and 33)
COST OF REVENUES (Notes 14, 25 and 33)
$194,294,044
160,324,556
100
82
$270,701,687
213,706,894
100
79
GROSS PROFIT
UNREALIZED GAINS
REALIZED GAINS
33,969,488
(1,611,132)
2,354,363
18
(1)
1
56,994,793
(2,354,363)
1,151,531
21
(1)
-
REALIZED GROSS PROFIT 34,712,719 18 55,791,961 20
OPERATING EXPENSES (Notes 25 and 33)
Selling and marketing
General and administrative
Research and development
18,767,921
6,149,762
11,431,489
10
3
6
21,716,367
5,521,638
13,783,569
8
2
5
Total operating expenses 36,349,172 19 41,021,574 15
OPERATING (LOSS) PROFIT (1,636,453) (1) 14,770,387 5
NON-OPERATING INCOME AND EXPENSES
Other income (Note 25)
Other gains and losses (Note 25)
Finance costs
Share of the profit or loss of subsidiaries, associates and joint ventures (Note 16)
675,659
758,009
(6,550)
(1,075,872)
-
-
-
-
964,499
580,421
(320)
617,723
1
-
-
-
Total non-operating income and expenses 351,246 - 2,162,323 1
(Continued)
For the Years Ended December 31
2013 2012
Amount %Amount %
(LOSS) PROFIT BEFORE INCOME TAX
INCOME TAX (Note 26)
$(1,285,207)
(38,578)
(1)
-
$16,932,710
(119,135)
6
-
(LOSS) PROFIT FOR THE YEAR (1,323,785) (1) 16,813,575 6
OTHER COMPREHENSIVE INCOME AND LOSS
Exchange differences on translating foreign operations (Note 23) 1,649,412 1 (1,089,693) -
Unrealized gain (loss) on available-for-sale financial assets (Note 23) 42 - (4,713) -
Cash flow hedge (Notes 10 and 23) (194,052) - 194,052 -
Actuarial gain and loss arising from defined benefit plans (Note 22) (16,976) - (5,310) -
Share of the other comprehensive income of subsidiaries, associates and
joint ventures
(11,887) - 11,430 -
Income tax relating to the components of other comprehensive income
(Notes 22 and 26)
1,771 - 903 -
Other comprehensive income and loss for the year, net of income tax 1,428,310 1 (893,331) -
TOTAL COMPREHENSIVE INCOME FOR THE YEAR $104,525 - $15,920,244 6
(LOSS) EARNINGS PER SHARE (Note 27)
Basic $(1.60)
$20.21
Diluted $(1.60) $20.12
The accompanying notes are an integral part of the financial statements.
(Concluded)