HTC 2013 Annual Report Download - page 146
Download and view the complete annual report
Please find page 146 of the 2013 HTC annual report below. You can navigate through the pages in the report by either clicking on the pages listed below, or by using the keyword search tool below to find specific information within the annual report.-
 1
1 -
2
-
3
-
4
-
5
-
6
-
7
-
8
-
9
-
10
-
11
-
12
-
13
-
14
-
15
-
16
-
17
-
18
-
19
-
20
-
21
-
22
-
23
-
24
-
25
-
26
-
27
-
28
-
29
-
30
-
31
-
32
-
33
-
34
-
35
-
36
-
37
-
38
-
39
-
40
-
41
-
42
-
43
-
44
-
45
-
46
-
47
-
48
-
49
-
50
-
51
-
52
-
53
-
54
-
55
-
56
-
57
-
58
-
59
-
60
-
61
-
62
-
63
-
64
-
65
-
66
-
67
-
68
-
69
-
70
-
71
-
72
-
73
-
74
-
75
-
76
-
77
-
78
-
79
-
80
-
81
-
82
-
83
-
84
-
85
-
86
-
87
-
88
-
89
-
90
-
91
-
92
-
93
-
94
-
95
-
96
-
97
-
98
-
99
-
100
-
101
-
102
-
103
-
104
-
105
-
106
-
107
-
108
-
109
-
110
-
111
-
112
-
113
-
114
-
115
-
116
-
117
-
118
-
119
-
120
-
121
-
122
-
123
-
124
-
125
-
126
-
127
-
128
-
129
-
130
-
131
-
132
-
133
-
134
-
135
-
 136
136 -
 137
137 -
 138
138 -
 139
139 -
 140
140 -
 141
141 -
 142
142 -
 143
143 -
 144
144 -
 145
145 -
 146
146 -
 147
147 -
 148
148 -
 149
149 -
 150
150 -
 151
151 -
 152
152 -
 153
153 -
 154
154 -
 155
155 -
 156
156 -
157
-
158
-
159
-
160
-
161
-
162
 |
 |

FINANCIAL INFORMATION FINANCIAL INFORMATION
288 289
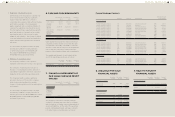
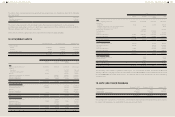
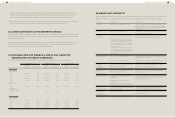
g. Items that were reclassified to other
comprehensive income
For the Year Ended
December 31
2013 2012
Exchange differences on
translating foreign operations
Exchange differences
arising during the year
$1,680,660 $(1,089,693)
Reclassification
adjustments relating
to foreign operations
disposed of in the year
(31,248) -
$1,649,412 $(1,089,693)
Available-for-sale financial
assets
Net fair value gain on
available-for-sale financial
assets during the year
$42 $11,408
Reclassification
adjustments relating to
available-for-sale financial
assets disposed of in the
year
(11,779) (4,631)
$(11,737) $6,777
Cash flow hedges
Fair value gains arising
during the year
$- $204,519
Reclassification
adjustments for amounts
recognized in profit or loss
(194,052) (10,467)
$(194,052) $194,052
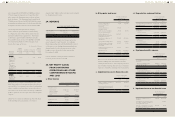
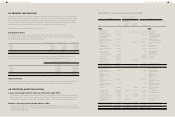
26. INCOME TAXES RELATING TO
CONTINUING OPERATIONS
a. Income tax recognized in profit or loss
For the Year Ended
December 31
2013 2012
Current tax
In respect of the current
period
$1,432,715 $3,948,447
In respect of the prior
periods
85,656 (151,465)
1,518,371 3,796,982
Deferred tax
In respect of the current
period
(390,230) (662,607)
Adjustments to deferred
tax attributable to changes
in tax rates and laws
- (1,298,103)
(390,230) (1,960,710)
Income tax recognized in
profit or loss
$1,128,141 $1,836,272
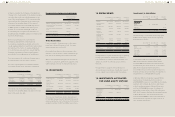
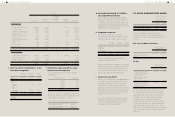
b. Income tax recognized in other comprehensive income
For the Year Ended December 31
2013 2012
Deferred tax
Recognized in current year
Actuarial gain and loss (tax benefit) $(1,794) $(915)
c. Current tax assets and liabilities
December
31, 2013
December
31, 2012
January 1,
2012
Current tax assets
Tax refund receivable $238,085 $61,532 $263,116
Current tax liabilities
Income tax payable $1,040,128 $2,713,373 $10,570,682
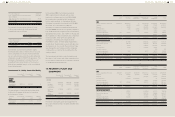
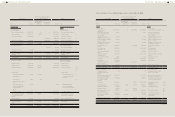
d. Deferred tax balances
The movements of deferred tax assets and deferred tax liabilities for the years ended December 31, 2013
and 2012 were as follows:
2013
Opening
Balance
Recognized in
Profit or Loss
Recognized
in Other
Comprehensive
Income
Disposal of
Subsidiaries
Translation
Adjustment
Closing
Balance
Deferred tax assets
Temporary differences
Unrealized royalties $2,985,884 $(556,451) $- $- $- $2,429,433
Unrealized marketing expenses 2,336,469 (57,711) - - 60,145 2,338,903
Unrealized warranty expense 859,853 (162,739) - - 15,320 712,434
Allowance for loss on decline in
value of inventory
756,462 (220,526) - - 16,100 552,036
Unrealized profit 365,524 (63,257) - - - 302,267
Unrealized salary and welfare 357,322 8,236 - (1,416) 10,783 374,925
Unrealized contingent losses on
purchase orders
70,779 29,166 - - - 99,945
Others 294,018 158,624 (915) (3,295) (42,758) 405,674
Loss carryforwards 484 1,449,272 - (508) 370 1,449,618
Investment credits 663,047 (663,047) - - - -
$8,689,842 $(78,433) $(915) $(5,219) $59,960 $8,665,235
Deferred tax liabilities
Temporary differences
Unrealized gain on investments $470,743 $(407,873) $- $- $16,580 $79,450
Financial assets at FVTPL 2,961 16,515 - - - 19,476
Defined benefit plans 35,034 (17,227) (2,709) - - 15,098
Others 139,198 (60,078) - (2,622) (39,400) 37,098
$647,936 $(468,663) $(2,709) $(2,622) $(22,820) $151,122
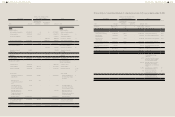
The income tax for the years ended December
31, 2013 and 2012 can be reconciled to the
accounting profit as follows:
For the Year Ended
December 31
2013 2012
(Loss) profit before income
tax
$(195,644) $19,458,065
Income tax calculated at 17% - 3,307,871
Effect of expenses that
were not deductible in
determining taxable profit
210,430 398,686
Effect of temporary
differences
(152,462) (2,052,711)
Effect of investment tax
credits
(1,126,249) (1,351,783)
Effect of loss carryforward (2,298) (6,695)
Effect of income that is
exempt from taxation
(501) (314,340)
Additional income tax under
the Alternative Minimum Tax
Act
- 46,334
Additional 10% income tax
on unappropriated earnings
1,126,249 2,315,062
Effect of Alternative
Minimum Tax rate changes
from 10% to 12% on deferred
income tax (effective in
2013)
- (1,298,103)
Effect of different tax rates
of subsidiaries operating in
other jurisdictions
987,316 943,416
Adjustments for prior years'
tax
85,656 (151,465)
Income tax recognized in
profit or loss
$1,128,141 $1,836,272