HTC 2013 Annual Report Download - page 64
Download and view the complete annual report
Please find page 64 of the 2013 HTC annual report below. You can navigate through the pages in the report by either clicking on the pages listed below, or by using the keyword search tool below to find specific information within the annual report.-
 1
1 -
2
-
3
-
4
-
5
-
6
-
7
-
8
-
9
-
10
-
11
-
12
-
13
-
14
-
15
-
16
-
17
-
18
-
19
-
20
-
21
-
22
-
23
-
24
-
25
-
26
-
27
-
28
-
29
-
30
-
31
-
32
-
33
-
34
-
35
-
36
-
37
-
38
-
39
-
40
-
41
-
42
-
43
-
44
-
45
-
46
-
47
-
48
-
49
-
50
-
51
-
52
-
53
-
 54
54 -
 55
55 -
 56
56 -
 57
57 -
 58
58 -
 59
59 -
 60
60 -
 61
61 -
 62
62 -
 63
63 -
 64
64 -
 65
65 -
 66
66 -
 67
67 -
 68
68 -
 69
69 -
 70
70 -
 71
71 -
 72
72 -
 73
73 -
 74
74 -
75
-
76
-
77
-
78
-
79
-
80
-
81
-
82
-
83
-
84
-
85
-
86
-
87
-
88
-
89
-
90
-
91
-
92
-
93
-
94
-
95
-
96
-
97
-
98
-
99
-
100
-
101
-
102
-
103
-
104
-
105
-
106
-
107
-
108
-
109
-
110
-
111
-
112
-
113
-
114
-
115
-
116
-
117
-
118
-
119
-
120
-
121
-
122
-
123
-
124
-
125
-
126
-
127
-
128
-
129
-
130
-
131
-
132
-
133
-
134
-
135
-
136
-
137
-
138
-
139
-
140
-
141
-
142
-
143
-
144
-
145
-
146
-
147
-
148
-
149
-
150
-
151
-
152
-
153
-
154
-
155
-
156
-
157
-
158
-
159
-
160
-
161
-
162
 |
 |

FINANCIAL STATUS, OPERATING RESULTS AND RISK MANAGEMENT FINANCIAL STATUS, OPERATING RESULTS AND RISK MANAGEMENT
124 125
FINANCIAL STATUS,
OPERATING RESULTS AND RISK
MANAGEMENT
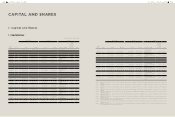
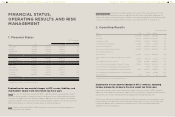
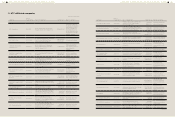
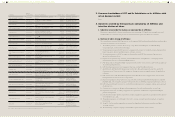
1. Financial Status
Unit:NT$ thousands
Item 2013 2012
Difference
Amount %
Current Assets 111,507,281 136,132,425 (24,625,144) (18)
Properties 25,561,399 25,990,766 (429,367) (2)
Intangible Assets 8,664,066 11,683,170 (3,019,104) (26)
Other Assets 26,896,441 33,442,631 (6,546,190) (20)
Total Assets 172,629,187 207,248,992 (34,619,805) (17)
Current Liabilities 94,513,990 126,268,363 (31,754,373) (25)
Non-current Liabilities 407,537 707,935 (300,398) (42)
Total Liabilities 94,921,527 126,976,298 (32,054,771) (25)
Capital Stock 8,423,505 8,520,521 (97,016) (1)
Capital Surplus 15,360,307 16,601,557 (1,241,250) (7)
Retained Earnings 66,286,308 70,102,031 (3,815,723) (5)
Other Equity 557,698 (885,925) 1,443,623 (163)
Treasury Stock (12,920,158) (14,065,490) 1,145,332 (8)
Non-Controlling Interest - - -
Total Stockholders' Equity 77,707,660 80,272,694 (2,565,034) (3)
* All numbers above are based on consolidated financial statements.
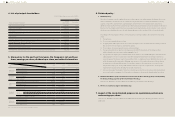
Explanations for any material changes in HTC's assets, liabilities, and
shareholders' equity in the most recent two fiscal years
Assets: The level of current assets decreased in 2013 vs. 2012. This reduction was mainly due to lower
revenue, as the global market competition increases, resulting in net cash outflow and lower accounts
receivables. Intangible assets saw a reduction in 2013 vs. 2012, due to the derecognition of investment
premium of intangible assets as the disposal of subsidiary companies. Other assets saw a decrease from
2012 to 2013, mainly due to disposal of residual interest of affiliated enterprises.
Debt: Liabilities decreased from 2012 to 2013, mainly due to lower revenues and related reductions in
purchasing and accounts payables.
Shareholders' Equity: A reduction in retained earnings was the result of the continued payout of a cash
dividend based on historical rates and reduced profits caused by lower revenue. Other adjustments to
shareholders' equity increased mainly due to cumulative exchange rate adjustments recognized by foreign
operations. The amount of treasury stock decreased because of the retirement of treasury stock.
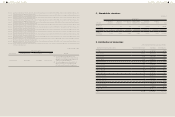
2. Operating Results
Unit:NT$ thousands
Item 2013 2012 Difference %
Revenues 203,402,648 289,020,175 (85,617,527) (30)
Gross Profit 42,270,753 72,930,849 (30,660,096) (42)
Operating (Loss) Profit (3,970,522) 18,827,314 (22,797,836) (121)
Non-operating Income and Expenses 3,774,878 630,751 3,144,127 498
Net Income (Loss) Before Tax (195,644) 19,458,065 (19,653,709) (101)
Net Income (Loss) From Continuing Operations (1,323,785) 17,621,793 (18,945,578) (108)
Non-Continuing Operations Loss - - - -
Net Income (Loss) (1,323,785) 17,621,793 (18,945,578) (108)
Other Comprehensive Income And Loss For The Year, Net of Income
Tax 1,428,310 (893,331) 2,321,641 (260)
Total Comprehensive Income For The Year 104,525 16,728,462 (16,623,937) (99)
(Loss) Profit For The Year Attributable To Owners Of The Parent (1,323,785) 16,813,575 (18,137,360) (108)
(Loss) Profit For The Year Attributable To Non-Controlling Interest - 808,218 (808,218) (100)
Total Comprehensive Income Attributable To Owners Of the Parent 104,525 15,920,244 (15,815,719) (99)
Total Comprehensive Income Attributable To Non-Controlling Interest - 808,218 (808,218) (100)
Earnings Per Share (1.60) 20.21 (22) (108)
* All numbers above are based on consolidated financial statements.。
Explanations for any material changes in HTC's revenues, operating
income, and pre-tax income in the most recent two fiscal years
Intensifying competition in the world's mobile phone market led to lower revenue in 2013 compared to
2012. Gross profit in 2013 was down 42% vs. 2012 as a result of increasingly competitive product pricing. To
maintain the scope of global marketing efforts operating profit were reduced by 121% YoY.
HTC's revenue comes mainly from its primary business. Main non-operating income and expenses come
from the disposal of residual shares of Associates. Other comprehensive income for the year increased
compared to 2012 due to the exchange rate fluctuation from recognizing accumulated translation
adjustment of overseas subsidiaries.