HTC 2013 Annual Report Download - page 112
Download and view the complete annual report
Please find page 112 of the 2013 HTC annual report below. You can navigate through the pages in the report by either clicking on the pages listed below, or by using the keyword search tool below to find specific information within the annual report.-
 1
1 -
2
-
3
-
4
-
5
-
6
-
7
-
8
-
9
-
10
-
11
-
12
-
13
-
14
-
15
-
16
-
17
-
18
-
19
-
20
-
21
-
22
-
23
-
24
-
25
-
26
-
27
-
28
-
29
-
30
-
31
-
32
-
33
-
34
-
35
-
36
-
37
-
38
-
39
-
40
-
41
-
42
-
43
-
44
-
45
-
46
-
47
-
48
-
49
-
50
-
51
-
52
-
53
-
54
-
55
-
56
-
57
-
58
-
59
-
60
-
61
-
62
-
63
-
64
-
65
-
66
-
67
-
68
-
69
-
70
-
71
-
72
-
73
-
74
-
75
-
76
-
77
-
78
-
79
-
80
-
81
-
82
-
83
-
84
-
85
-
86
-
87
-
88
-
89
-
90
-
91
-
92
-
93
-
94
-
95
-
96
-
97
-
98
-
99
-
100
-
101
-
 102
102 -
 103
103 -
 104
104 -
 105
105 -
 106
106 -
 107
107 -
 108
108 -
 109
109 -
 110
110 -
 111
111 -
 112
112 -
 113
113 -
 114
114 -
 115
115 -
 116
116 -
 117
117 -
 118
118 -
 119
119 -
 120
120 -
 121
121 -
 122
122 -
123
-
124
-
125
-
126
-
127
-
128
-
129
-
130
-
131
-
132
-
133
-
134
-
135
-
136
-
137
-
138
-
139
-
140
-
141
-
142
-
143
-
144
-
145
-
146
-
147
-
148
-
149
-
150
-
151
-
152
-
153
-
154
-
155
-
156
-
157
-
158
-
159
-
160
-
161
-
162
 |
 |

FINANCIAL INFORMATION FINANCIAL INFORMATION
220 221
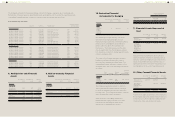
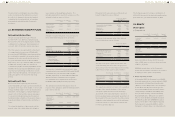
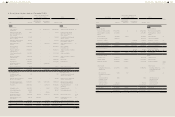
28. SHARE-BASED PAYMENT
ARRANGEMENTS
Qualified employees of the Company and its
subsidiaries were granted 15,000 thousand
options in November 2013. Each option entitles
the holder to subscribe for one common share of
the Company. The options granted are valid for 7
years and exercisable at certain percentages after
the second anniversary from the grant date. The
exercise price equals to the closing price of the
Company's common shares on the grant date. For
any subsequent changes in the Company's common
shares, the exercise price is adjusted accordingly.
Information on employee share options as of the
reporting date was as follows:
For the Year Ended
December 31
Number of
Options
(In
Thousands)
Weighted
average
Exercise
Price
(NT$)
Balance at January 1
Options granted during the year
-
15,000
$-
149
Balance at December 31 15,000
Options exercisable, end of the year $-
Weighted-average fair value of
options granted per unit (NT$) $43.603
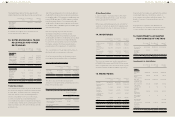
Information about outstanding options as of
December 31, 2013 and 2012 was as follows:
December 31,
2013
December 31,
2012
January 1,
2012
Range of exercise
price (NT$)
Weighted-
average remaining
contractual life
(years)
$149
6.8 years
$-
-
$-
-
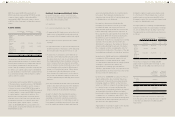
Options granted in November 2013 were priced
using the trinomial option pricing model and the
inputs to the model were as follows:
November 2013
Grant-date share price (NT$)
Exercise price (NT$)
Expected volatility
Expected life (years)
Expected dividend yield
Risk-free interest rate
$149
149
45.83%
7 years
5.00%
1.63%
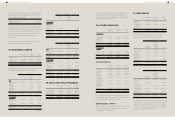
31. CAPITAL RISK MANAGEMENT
The Company manages its capital to ensure
its ability to continue as a going concern while
maximizing the returns to shareholders. The
Company periodically reviews its capital structure
by taking into consideration macroeconomic
conditions, prevailing interest rate, and adequacy
of cash flows generated from operations; as
the situation would allow, the Company pays
dividends, issues new shares, repurchases shares,
issues new debt, and redeems debt.
The Company is not subject to any externally
imposed capital requirements.
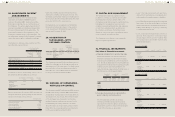
32. FINANCIAL INSTRUMENTS
Fair Value of Financial Instruments
a. Financial instruments not carried at fair value
Financial instruments not carried at fair value
held by the Company include held-to-maturity
financial assets and financial assets measured at
cost. Except as detailed in the following table, the
management considers that the carrying amounts
of financial assets and financial liabilities not
carried at fair value approximate their fair value or
the fair value are not measured reliably.
December 31,
2013
December 31,
2012
January 1, 2012
Carrying
Amount
Fair
Value
Carrying
Amount
Fair
Value
Carrying
Amount
Fair
Value
Assets
Held-to-
maturity
investments $- $- $101,459 $101,436 $204,597 $203,783
b. Fair value measurements recognized in the
parent company only balance sheet.
The following table provides an analysis
of financial instruments that are measured
subsequent to initial recognition at fair value,
grouped into Levels 1 to 3 based on the degree
to which the fair value is observable:
Expected volatility was based on the historical
share price volatility over the past one year. The
Company assumed that employees would exercise
their options after the vesting date when the share
price was 1.63 times the exercise price.
Compensation cost recognized was NT$26,742
thousand, including subsidiaries' compensation
costs amounting to NT$3,299 thousand, for the
year ended December 31, 2013.
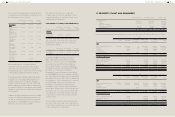
29. ACQUISITION OF
SUBSIDIARIES - WITH
OBTAINED CONTROL
Principal
Activity
Date of
Acquisition
Proportion of
Voting Equity
Interests
Acquired (%)
Consideration
Transferred
FunStream
Corporation
Design,
research and
development
of 3-D
technolog
February
2012
100.00% $45,090
The Company acquired FunStream Corporation to
obtain its techniques in the design, research and
development of 3-D technology. For details about
the acquisition of this subsidiary, please refer to
Note 29 to the consolidated financial statements
for the year ended December 31, 2013.
30. DISPOSAL OF SUBSIDIARIES -
WITH LOSS OF CONTROL
The Company and CHT each had held 50% share of
Huada, respectively. In March 2012, Huada held a
stockholders' meeting and re-elected its directors
and supervisors. As a result, the investment type
of the Company was changed to joint venture
and the Company continued to account for this
investment by the equity method. For details
about the disposal of subsidiaries, please refer to
Note 30 to the consolidated financial statements
for the year ended December 31, 2013.
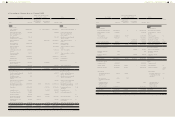
‧ Level 1 fair value measurements are those
derived from quoted prices (unadjusted) in
active markets for identical assets or liabilities;
‧ Level 2 fair value measurements are those derived
from inputs other than quoted prices included
within Level 1 that are observable for the asset or
liability, either directly (i.e. as prices) or indirectly
(i.e. derived from prices); and
‧ Level 3 fair value measurements are those
derived from valuation techniques that
include inputs for the asset or liability that
are not based on observable market data
(unobservable inputs).
December 31, 2013
Level 1 Level 2 Level 3 Total
Financial
assets at
FVTPL
Derivative
financial
instruments
$- $162,297 $- $162,297
Available-
for-sale
financial
assets
Domestic
listed stocks
- equity
investments
$239 $- $- $239
December 31, 2012
Level 1 Level 2 Level 3 Total
Financial
assets at
FVTPL
Derivative
financial
instruments
$- $6,950 $- $6,950
Available-
for-sale
financial
assets
Domestic
listed stocks
- equity
investments
$197 $- $- $197
Hedging
derivative
assets
Derivative
financial
instruments
$- $204,519 $- $204,519