HTC 2013 Annual Report Download - page 81
Download and view the complete annual report
Please find page 81 of the 2013 HTC annual report below. You can navigate through the pages in the report by either clicking on the pages listed below, or by using the keyword search tool below to find specific information within the annual report.-
 1
1 -
2
-
3
-
4
-
5
-
6
-
7
-
8
-
9
-
10
-
11
-
12
-
13
-
14
-
15
-
16
-
17
-
18
-
19
-
20
-
21
-
22
-
23
-
24
-
25
-
26
-
27
-
28
-
29
-
30
-
31
-
32
-
33
-
34
-
35
-
36
-
37
-
38
-
39
-
40
-
41
-
42
-
43
-
44
-
45
-
46
-
47
-
48
-
49
-
50
-
51
-
52
-
53
-
54
-
55
-
56
-
57
-
58
-
59
-
60
-
61
-
62
-
63
-
64
-
65
-
66
-
67
-
68
-
69
-
70
-
 71
71 -
 72
72 -
 73
73 -
 74
74 -
 75
75 -
 76
76 -
 77
77 -
 78
78 -
 79
79 -
 80
80 -
 81
81 -
 82
82 -
 83
83 -
 84
84 -
 85
85 -
 86
86 -
 87
87 -
 88
88 -
 89
89 -
 90
90 -
 91
91 -
92
-
93
-
94
-
95
-
96
-
97
-
98
-
99
-
100
-
101
-
102
-
103
-
104
-
105
-
106
-
107
-
108
-
109
-
110
-
111
-
112
-
113
-
114
-
115
-
116
-
117
-
118
-
119
-
120
-
121
-
122
-
123
-
124
-
125
-
126
-
127
-
128
-
129
-
130
-
131
-
132
-
133
-
134
-
135
-
136
-
137
-
138
-
139
-
140
-
141
-
142
-
143
-
144
-
145
-
146
-
147
-
148
-
149
-
150
-
151
-
152
-
153
-
154
-
155
-
156
-
157
-
158
-
159
-
160
-
161
-
162
 |
 |
FINANCIAL INFORMATION FINANCIAL INFORMATION
158 159
FINANCIAL INFORMATION
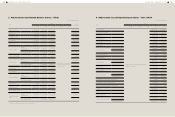
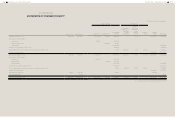
1. Abbreviated Balance Sheets for the Past Five
Fiscal Years
1. Abbreviated Balance Sheets - IFRSs
Unit:NT$ thousands
Item
Year
2013 2012 2011 2010 2009
Current Assets 86,792,110 120,322,646 178,751,062
Abbreviated balance sheet was
based on ROC GAAP
Properties 19,773,608 19,726,836 15,318,600
Intangible Assets 1,650,891 1,717,150 2,241,541
Other Assets 59,337,585 55,213,207 50,810,264
Total Assets 167,554,194 196,979,839 247,121,467
Current Liabilities
Before Appropriation 89,731,340 116,556,611 145,631,489
After Appropriation * 118,219,066 178,880,574
Non-current Liabilities 115,194 150,534 188,097
Total Liabilities
Before Appropriation 89,846,534 116,707,145 145,819,586
After Appropriation * 118,369,600 179,068,671
Capital Stock 8,423,505 8,520,521 8,520,521
Capital Surplus 15,360,307 16,601,557 16,601,557
Retained Earnings
Before Appropriation 66,286,308 70,102,031 86,542,008
After Appropriation * 68,439,576 53,292,923
Other Equity 557,698 (885,925) 2,939
Treasury Stock (12,920,158) (14,065,490) (10,365,144)
Total Stockholders'
Equity
Before Appropriation 77,707,660 80,272,694 101,301,881
After Appropriation * 78,610,239 68,052,796
*:Subject to change after shareholders' meeting resolution
2. Abbreviated Balance Sheets - ROC GAAP
Unit:NT$ thousands
Item
Year
2013 2012 2011 2010 2009
Current Assets
Abbreviated balance sheet was based on IFRSs
156,875,067 101,470,633
Long-term Investments 10,708,420 6,506,194
Properties 10,941,230 8,314,177
Intangible Assets 208,581 -
Other Assets 5,317,155 3,330,938
Total Assets 184,050,453 119,621,942
Current Liabilities
Before Appropriation 109,335,331 53,980,282
After Appropriation 139,226,420 74,102,614
Long-term Liabilities - -
Other Liabilities 628 1,210
Total Liabilities
Before Appropriation 109,335,959 53,981,492
After Appropriation 139,227,048 74,103,824
Capital Stock 8,176,532 7,889,358
Capital Surplus 10,820,744 9,099,923
Retained Earnings
Before Appropriation 63,150,566 48,637,773
After Appropriation 32,855,543 28,128,473
Unrealized Loss on Financial Instruments (885) (1,658)
Cumulative Translation Adjustments (579,849) 15,088
Net Loss Not Recognized As Pension Cost (121) (34)
Treasury Stock (6,852,493) -
Total Stockholders'
Equity
Before Appropriation 74,714,494 65,640,450
After Appropriation 44,823,405 45,518,118