HTC 2013 Annual Report Download - page 110
Download and view the complete annual report
Please find page 110 of the 2013 HTC annual report below. You can navigate through the pages in the report by either clicking on the pages listed below, or by using the keyword search tool below to find specific information within the annual report.-
 1
1 -
2
-
3
-
4
-
5
-
6
-
7
-
8
-
9
-
10
-
11
-
12
-
13
-
14
-
15
-
16
-
17
-
18
-
19
-
20
-
21
-
22
-
23
-
24
-
25
-
26
-
27
-
28
-
29
-
30
-
31
-
32
-
33
-
34
-
35
-
36
-
37
-
38
-
39
-
40
-
41
-
42
-
43
-
44
-
45
-
46
-
47
-
48
-
49
-
50
-
51
-
52
-
53
-
54
-
55
-
56
-
57
-
58
-
59
-
60
-
61
-
62
-
63
-
64
-
65
-
66
-
67
-
68
-
69
-
70
-
71
-
72
-
73
-
74
-
75
-
76
-
77
-
78
-
79
-
80
-
81
-
82
-
83
-
84
-
85
-
86
-
87
-
88
-
89
-
90
-
91
-
92
-
93
-
94
-
95
-
96
-
97
-
98
-
99
-
 100
100 -
 101
101 -
 102
102 -
 103
103 -
 104
104 -
 105
105 -
 106
106 -
 107
107 -
 108
108 -
 109
109 -
 110
110 -
 111
111 -
 112
112 -
 113
113 -
 114
114 -
 115
115 -
 116
116 -
 117
117 -
 118
118 -
 119
119 -
 120
120 -
121
-
122
-
123
-
124
-
125
-
126
-
127
-
128
-
129
-
130
-
131
-
132
-
133
-
134
-
135
-
136
-
137
-
138
-
139
-
140
-
141
-
142
-
143
-
144
-
145
-
146
-
147
-
148
-
149
-
150
-
151
-
152
-
153
-
154
-
155
-
156
-
157
-
158
-
159
-
160
-
161
-
162
 |
 |

FINANCIAL INFORMATION FINANCIAL INFORMATION
216 217
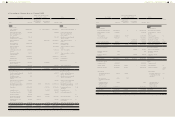
c. Impairment losses on financial assets
For the Year Ended
December 31
2013 2012
Trade receivables (included in
operating expense)
$991,821 $505,078
d. Depreciation and amortization
For the Year Ended
December 31
2013 2012
Property, plant and equipment $1,602,946 $1,292,949
Intangible assets 651,632 524,391
$2,254,578 $1,817,340
Classification of depreciation -
by function
Cost of revenues $873,928 $687,259
Operating expenses 729,018 605,690
$1,602,946 $1,292,949
Classification of amortization -
by function
Cost of revenues $- $4,300
Operating expenses 651,632 520,091
$651,632 $524,391
e. Employee benefits expense
For the Year Ended
December 31
2013 2012
Post-employment benefits (Note 23)
Defined contribution plans $428,469 $411,916
Defined benefit plans 1,128 2,369
429,597 414,285
Share-based payments
Equity-settled share-based
payments
23,443 -
Other employee benefits 10,529,260 12,021,593
Total employee benefits expense $10,982,300 $12,435,878
Classification - by function
Cost of revenues $5,625,526 $5,163,909
Operating expenses 5,356,774 7,271,969
$10,982,300 $12,435,878
f. Impairment losses on non-financial assets
For the Year Ended
December 31
2013 2012
Inventories (included in cost of
revenues)
$439,139 $1,211,554
Investments accounted for by
the equity method (included in
other gains and losses)
- 45,017
Intangible assets (including in
other gains and losses)
111,085 -
$550,224 $1,256,571
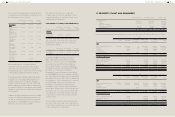
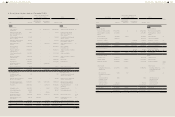
26. INCOME TAXES RELATING TO
CONTINUING OPERATIONS
a. Income tax recognized in profit or loss
For the Year Ended
December 31
2013 2012
Current tax
In respect of the current
period
$3,525 $1,341,594
Deferred tax
In respect of the current
period
35,053 75,644
Adjustments to deferred tax
attributable to changes in
tax rates and laws
- (1,298,103)
35,053 (1,222,459)
Income tax recognized in
profit or loss
$38,578 $119,135
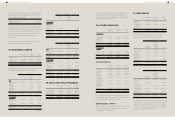
The income tax for the years ended December
31, 2013 and 2012 can be reconciled to the
accounting profit as follows:
For the Year Ended
December 31
2013 2012
(Loss) profit before income
tax
$(1,285,207) $16,932,710
Income tax calculated at 17% - 2,878,561
Effect of expenses that were
not deductible in determining
taxable profit
Share of the profit or loss of
subsidiaries, associates and
joint ventures
29,858
182,898
26,285
(105,013)
(Continued)
For the Year Ended
December 31
2013 2012
Effect of temporary differences (177,703) (2,073,806)
Effect of investment tax credits (1,126,249) (1,351,783)
Effect of income that is exempt
from taxation
- (314,339)
Additional income tax under the
Alternative Minimum Tax Act
- 46,334
Additional 10% income tax on
unappropriated earnings
1,126,249 2,310,999
Effect of Alternative Minimum Tax
rate changes from 10% to 12% on
deferred income tax (effective in
2013)
- (1,298,103)
Overseas income tax 3,525 -
Income tax recognized in
profit or loss
$38,578 $119,135
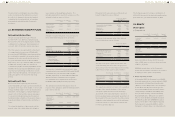
b. Income tax recognized in other
comprehensive income
For the Year Ended
December 31
2013 2012
Deferred tax
Recognized in current year
Actuarial gain and loss
(tax benefit)
$(1,771) $(903)
c. Current tax assets and liabilities
December
31, 2013
December
31, 2012
January 1,
2012
Current tax assets
Tax refund
receivable
$24,192 $- $-
Current tax
liabilities
Income tax
payable
$303 $1,424,006 $9,653,090
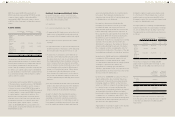
d. Deferred tax balances
The movements of deferred tax assets and deferred tax liabilities for the years ended December 31, 2013 and
2012 were as follows:
2013
Opening
Balance
Recognized in
Profit or Loss
Recognized
in Other
Comprehensive
Income Closing Balance
Deferred tax assets
Temporary differences
Allowance for loss on decline in value of inventory
Unrealized profit
Unrealized royalties
Unrealized marketing expenses
Unrealized warranty expense
Unrealized contingent losses on purchase orders
Others
$465,643
365,524
2,985,884
1,203,720
583,141
70,779
207,980
$(205,928)
(63,257)
(556,451)
426,200
(33,428)
29,166
160,438
$-
-
-
-
-
-
(903)
$259,715
302,267
2,429,433
1,629,920
549,713
99,945
367,515
Loss carryforward
Investment credit
5,882,671
-
663,047
(243,260)
837,428
(663,047)
(903)
-
-
5,638,508
837,428
-
$6,545,718 $(68,879) $(903) $6,475,936
Deferred tax liabilities
Temporary differences
Defined benefit plans
Financial assets at FVTPL
Unrealized gain on investments
$35,022
2,961
112,551
$(17,240)
16,515
(33,101)
$(2,674)
-
-
$15,108
19,476
79,450
$150,534 $(33,826) $(2,674) $114,034