HTC 2013 Annual Report Download - page 84
Download and view the complete annual report
Please find page 84 of the 2013 HTC annual report below. You can navigate through the pages in the report by either clicking on the pages listed below, or by using the keyword search tool below to find specific information within the annual report.-
 1
1 -
2
-
3
-
4
-
5
-
6
-
7
-
8
-
9
-
10
-
11
-
12
-
13
-
14
-
15
-
16
-
17
-
18
-
19
-
20
-
21
-
22
-
23
-
24
-
25
-
26
-
27
-
28
-
29
-
30
-
31
-
32
-
33
-
34
-
35
-
36
-
37
-
38
-
39
-
40
-
41
-
42
-
43
-
44
-
45
-
46
-
47
-
48
-
49
-
50
-
51
-
52
-
53
-
54
-
55
-
56
-
57
-
58
-
59
-
60
-
61
-
62
-
63
-
64
-
65
-
66
-
67
-
68
-
69
-
70
-
71
-
72
-
73
-
 74
74 -
 75
75 -
 76
76 -
 77
77 -
 78
78 -
 79
79 -
 80
80 -
 81
81 -
 82
82 -
 83
83 -
 84
84 -
 85
85 -
 86
86 -
 87
87 -
 88
88 -
 89
89 -
 90
90 -
 91
91 -
 92
92 -
 93
93 -
 94
94 -
95
-
96
-
97
-
98
-
99
-
100
-
101
-
102
-
103
-
104
-
105
-
106
-
107
-
108
-
109
-
110
-
111
-
112
-
113
-
114
-
115
-
116
-
117
-
118
-
119
-
120
-
121
-
122
-
123
-
124
-
125
-
126
-
127
-
128
-
129
-
130
-
131
-
132
-
133
-
134
-
135
-
136
-
137
-
138
-
139
-
140
-
141
-
142
-
143
-
144
-
145
-
146
-
147
-
148
-
149
-
150
-
151
-
152
-
153
-
154
-
155
-
156
-
157
-
158
-
159
-
160
-
161
-
162
 |
 |
FINANCIAL INFORMATION FINANCIAL INFORMATION
164 165
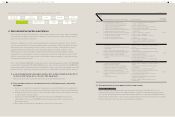
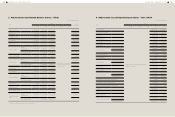
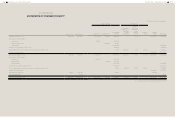
3. Financial Analysis for the Past Five Fiscal Years
(1) Financial Analysis - IFRSs
Item
Year
2013 2012 2011 2010 2009
Capital
Structure
Analysis
Debt Ratio(%) 54 59
Financial analysis was based on ROC
GAAP
Long-term Fund to Fixed Assets Ratio(%) 393 407
Liquidity
Analysis
Current Ratio(%) 97 103
Quick Ratio(%) 72 82
Debt Services Coverage Ratio(%) (195) 52,916
Operating
Performance
Analysis
Average Collection Turnover(Times)5.43 5.02
Days Sales Outstanding 67 73
Average Inventory Turnover ( Times)7.12 7.85
Average Payment Turnover ( Times)2.62 2.84
Average Inventory Turnover Days 51 46
Fixed Assets Turnover(Times)9.83 13.72
Total Assets Turnover ( Times)1.16 1.37
Profitability
Analysis
Return on Total Assets(%) (0.72) 7.57
Return on Equity(%) (1.68) 18.52
Paid-in Capital Ratio(%)
Operating Income (19.43) 173.35
Pre-tax Income (15.26) 198.73
Net Margin(%) (0.68) 6.21
Basic (Loss) Earnings Per Share(NT$)(1.60) 20.21
Cash Flow
Cash Flow Ratio(%) (14.76) 19.50
Cash Flow Adequacy Ratio(%) 113.13 128.67
Cash Flow Reinvestment Ratio(%) (17.28) (12.04)
Leverage
Operating Leverage (5.87) 2.37
Financial Leverage 1 1
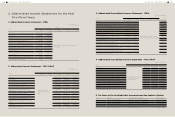
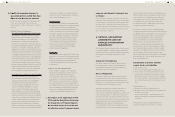
1. Capital Structure & Liquidity Analyses
As of year-end 2013, our debt ratio stood at 54% lower than last year level and current and quick
ratios were both lower at 97% and 72%, respectively. This situation reflected declines in revenue while
distributing dividends which caused net cash outflow to lower current and quick ratio compare to
previous year.
2. Operating Performance Analysis
Due to decline in revenue, fixed asset turnover, total asset turnover, and average collection turnover
were all lower than the previous year. Operation cost also lowered, inventory and account payable items
also decreased, causing inventory turnover days and payment turnover days to be lowered compared to
the previous year.
3. Profitability Analysis
On the back of declines in revenue, profitability decreased compared to the previous year given by
intensified market competition, price competition and sustainability for branding activities. Net margin
declined to -0.68% and EPS was NT$-1.6 in 2013.
4. Cash Flow Analysis
Due to the global competition in 2013, HTC faced a decline in revenue and turned net cash flows from
operating activities to net cash outflows, which brought net cash flow ratio to -15% and the cash flow
adequacy ratio to 113%. Cash flow reinvestment reduced to -17%.