HTC 2013 Annual Report Download - page 85
Download and view the complete annual report
Please find page 85 of the 2013 HTC annual report below. You can navigate through the pages in the report by either clicking on the pages listed below, or by using the keyword search tool below to find specific information within the annual report.-
 1
1 -
2
-
3
-
4
-
5
-
6
-
7
-
8
-
9
-
10
-
11
-
12
-
13
-
14
-
15
-
16
-
17
-
18
-
19
-
20
-
21
-
22
-
23
-
24
-
25
-
26
-
27
-
28
-
29
-
30
-
31
-
32
-
33
-
34
-
35
-
36
-
37
-
38
-
39
-
40
-
41
-
42
-
43
-
44
-
45
-
46
-
47
-
48
-
49
-
50
-
51
-
52
-
53
-
54
-
55
-
56
-
57
-
58
-
59
-
60
-
61
-
62
-
63
-
64
-
65
-
66
-
67
-
68
-
69
-
70
-
71
-
72
-
73
-
74
-
 75
75 -
 76
76 -
 77
77 -
 78
78 -
 79
79 -
 80
80 -
 81
81 -
 82
82 -
 83
83 -
 84
84 -
 85
85 -
 86
86 -
 87
87 -
 88
88 -
 89
89 -
 90
90 -
 91
91 -
 92
92 -
 93
93 -
 94
94 -
 95
95 -
96
-
97
-
98
-
99
-
100
-
101
-
102
-
103
-
104
-
105
-
106
-
107
-
108
-
109
-
110
-
111
-
112
-
113
-
114
-
115
-
116
-
117
-
118
-
119
-
120
-
121
-
122
-
123
-
124
-
125
-
126
-
127
-
128
-
129
-
130
-
131
-
132
-
133
-
134
-
135
-
136
-
137
-
138
-
139
-
140
-
141
-
142
-
143
-
144
-
145
-
146
-
147
-
148
-
149
-
150
-
151
-
152
-
153
-
154
-
155
-
156
-
157
-
158
-
159
-
160
-
161
-
162
 |
 |

FINANCIAL INFORMATION FINANCIAL INFORMATION
166 167
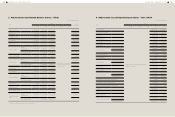
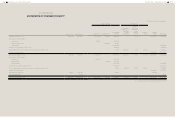
(2) Financial Analysis – ROC GAAP
Item
Year
2013 2012 2011 2010 2009
Capital
Structure
Analysis
Debt Ratio(%)
Financial analysis was
based on IFRSs
59 59 45
Long-term Fund to Fixed Assets Ratio(%) 658 683 790
Liquidity
Analysis
Current Ratio(%) 123 144 188
Quick Ratio(%) 100 120 171
Debt Services Coverage Ratio(%) 6,806 967,203 192,463
Operating
Performance
Analysis
Average Collection Turnover(Times)6.95 5.92 4.92
Days Sales Outstanding 53 62 74
Average Inventory Turnover ( Times)12.11 11.77 11.71
Average Payment Turnover ( Times)4.85 4.59 3.72
Average Inventory Turnover Days 30 31 31
Fixed Assets Turnover(Times)29.51 25.14 17.43
Total Assets Turnover ( Times)1.83 1.49 1.21
Profitability
Analysis
Return on Total Assets(%) 29 26 22
Return on Equity(%) 70 56 37
Paid-in Capital Ratio(%)
Operating Income 761 517 306
Pre-tax Income 820 544 320
Net Margin(%) 14 14 16
Basic Earnings Per Share(NT$)73.32 46.18 26.04
Cash Flow
Cash Flow Ratio(%) 58 37 51
Cash Flow Adequacy Ratio(%) 163 157 201
Cash Flow Reinvestment Ratio(%) 52 26 11
Leverage
Operating Leverage 1.35 1.43 1.54
Financial Leverage 1 1 1
(3) Consolidated Financial Analysis - IFRSs
Item
Year As of
2014.03.31
2013 2012 2011 2010 2009
Capital
Structure
Analysis
Debt Ratio(%) 55 61
Financial analysis was based on
ROC GAAP
54
Long-term Fund to Fixed Assets Ratio(%) 304 309 307
Liquidity
Analysis
Current Ratio(%) 118 108 117
Quick Ratio(%) 87 85 81
Debt Services Coverage Ratio(%) (22) 11,347 (386)
Operating
Performance
Analysis
Average Collection Turnover(Times)5.83 5.27 5.06
Days Sales Outstanding 63 69 72
Average Inventory Turnover(Times)5.81 6.96 3.81
Average Payment Turnover(Times)2.69 2.84 2.34
Average Inventory Turnover Days 63 52 96
Fixed Assets Turnover(Times)7.96 11.12 5.32
Total Assets Turnover(Times)1.18 1.39 0.80
Profitability
Analysis
Return on Total Assets(%) (0.69) 7.61 (1.11)
Return on Equity(%) (1.68) 19.30 (2.44)
Paid-in Capital Ratio(%)
Operating Income (47.14) 220.96 (24.37)
Pre-tax Income (2.32) 228.37 (22.39)
Net Margin(%) (0.65) 6.10 (5.68)
Basic Earnings Per Share(NT$)(1.60) 20.21 (2.28)
Cash Flow
Cash Flow Ratio(%) (17.17) 18.69 (13.01)
Cash Flow Adequacy Ratio(%) 109.71 126.39 96.82
Cash Flow Reinvestment Ratio(%) (19.78) (10.66) (12.81)
Leverage
Operating Leverage (5.87) 2.37 (2.01)
Financial Leverage 1 1 1