HTC 2013 Annual Report Download - page 141
Download and view the complete annual report
Please find page 141 of the 2013 HTC annual report below. You can navigate through the pages in the report by either clicking on the pages listed below, or by using the keyword search tool below to find specific information within the annual report.-
 1
1 -
2
-
3
-
4
-
5
-
6
-
7
-
8
-
9
-
10
-
11
-
12
-
13
-
14
-
15
-
16
-
17
-
18
-
19
-
20
-
21
-
22
-
23
-
24
-
25
-
26
-
27
-
28
-
29
-
30
-
31
-
32
-
33
-
34
-
35
-
36
-
37
-
38
-
39
-
40
-
41
-
42
-
43
-
44
-
45
-
46
-
47
-
48
-
49
-
50
-
51
-
52
-
53
-
54
-
55
-
56
-
57
-
58
-
59
-
60
-
61
-
62
-
63
-
64
-
65
-
66
-
67
-
68
-
69
-
70
-
71
-
72
-
73
-
74
-
75
-
76
-
77
-
78
-
79
-
80
-
81
-
82
-
83
-
84
-
85
-
86
-
87
-
88
-
89
-
90
-
91
-
92
-
93
-
94
-
95
-
96
-
97
-
98
-
99
-
100
-
101
-
102
-
103
-
104
-
105
-
106
-
107
-
108
-
109
-
110
-
111
-
112
-
113
-
114
-
115
-
116
-
117
-
118
-
119
-
120
-
121
-
122
-
123
-
124
-
125
-
126
-
127
-
128
-
129
-
130
-
 131
131 -
 132
132 -
 133
133 -
 134
134 -
 135
135 -
 136
136 -
 137
137 -
 138
138 -
 139
139 -
 140
140 -
 141
141 -
 142
142 -
 143
143 -
 144
144 -
 145
145 -
 146
146 -
 147
147 -
 148
148 -
 149
149 -
 150
150 -
 151
151 -
152
-
153
-
154
-
155
-
156
-
157
-
158
-
159
-
160
-
161
-
162
 |
 |
FINANCIAL INFORMATION FINANCIAL INFORMATION
278 279
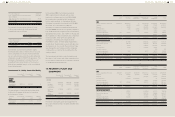
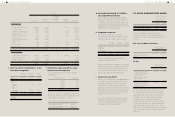
The above items of property, plant and equipment were depreciated on a straight-line basis at the following
rates per annum:
Building
Machinery and equipment
Other equipment
5-50 years
3-6 years
3-5 years
The major component parts of the buildings held by the Company included plants, electro-powering
machinery and engineering systems, etc., which were depreciated over their estimated useful lives of 40 to
50 years, 20 years and 5 to 10 years, respectively.
There were no interests capitalized for the years ended December 31, 2013 and 2012.
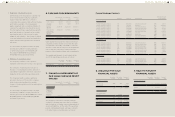
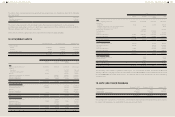
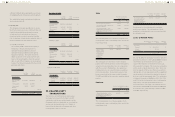
18. INTANGIBLE ASSETS
December 31, 2013 December 31, 2012 January 1, 2012
Carrying amounts
Patents $7,668,901 $9,180,674 $11,152,098
Goodwill 174,253 1,534,366 10,812,564
Other intangible assets 820,912 968,130 802,817
$8,664,066 $11,683,170 $22,767,479
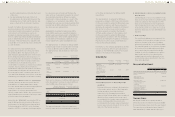
2013
Patents Goodwill Other Intangible
Assets Total
Cost
Balance, beginning of the year $11,239,554 $1,681,561 $1,603,108 $14,524,223
Additions
Acquisition 22,213 - 200,795 223,008
Transfer from prepayment - - 509,710 509,710
Disposal (6,778) - (24,709) (31,487)
Adjustment in acquisition of a subsidiary - (67,690) (39,966) (107,656)
Disposal of subsidiaries - (785,338) (608,519) (1,393,857)
Translation adjustment 241,501 46,251 49,013 336,765
Balance, end of the year 11,496,490 874,784 1,689,432 14,060,706
Accumulated amortization
Balance, beginning of the year 2,058,880 - 634,978 2,693,858
Amortization expenses 1,618,246 - 350,246 1,968,492
Disposal - - (22,372) (22,372)
Disposal of subsidiaries - - (283,487) (283,487)
Translation adjustment 39,378 - 26,314 65,692
Balance, end of the year 3,716,504 - 705,679 4,422,183
Accumulated impairment
Balance, beginning of the year - 147,195 - 147,195
Impairment losses 111,085 591,306 161,961 864,352
Disposal of subsidiaries - (45,017) - (45,017)
Translation adjustment - 7,047 880 7,927
Balance, end of the year 111,085 700,531 162,841 974,457
Net book value, end of the year $7,668,901 $174,253 $820,912 $8,664,066
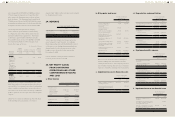
2012
Patents Goodwill Other Intangible
Assets Total
Cost
Balance, beginning of the year $11,608,540 $10,905,878 $1,203,368 $23,717,786
Additions
Acquisition 11,464 - 545,117 556,581
Difference between the cost of investments and the
Company's share in investees' net assets
- 45,017 - 45,017
Adjustments of acquisition cost - (26,226) - (26,226)
Reclassification - (5,717,960) 5,717,960 -
Disposal - - (64,719) (64,719)
Disposal of subsidiaries (35,323) (3,485,380) (5,713,752) (9,234,455)
Translation adjustment (345,127) (39,768) (84,866) (469,761)
Balance, end of the year 11,239,554 1,681,561 1,603,108 14,524,223
Accumulated amortization
Balance, beginning of the year 456,442 - 400,551 856,993
Amortization expenses 1,625,124 - 422,557 2,047,681
Disposal - - (64,719) (64,719)
Disposal of subsidiaries (1,893) - (115,699) (117,592)
Translation adjustment (20,793) - (7,712) (28,505)
Balance, end of the year 2,058,880 - 634,978 2,693,858
Accumulated impairment
Balance, beginning of the year - 93,314 - 93,314
Impairment losses - 57,621 - 57,621
Translation adjustment - (3,740) - (3,740)
Balance, end of the year - 147,195 - 147,195
Net book value, end of the year $9,180,674 $1,534,366 $968,130 $11,683,170
The Company owns patents of graphics technologies. As of December 31, 2013, December 31, 2012 and
January 1, 2012, the carrying amounts of such patents were NT$6,641,606 thousand, NT$7,555,334 thousand
and NT$9,008,002 thousand, respectively. The patents will be fully amortized over their remaining
economic lives.
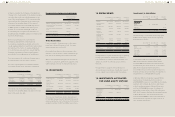
19. NOTE AND TRADE PAYABLES
December 31, 2013 December 31, 2012 January 1, 2012
Note payables
Trade payables
Trade payables - related parties
$1,355
46,266,193
8,303
$294
73,598,634
19,269
$3,779
78,469,351
-
$46,275,851 $73,618,197 $78,473,130
The average term of payment is four months. The Company has financial risk management policies in place
to ensure that all payables are paid within the pre-agreed credit terms.