HTC 2013 Annual Report Download - page 137
Download and view the complete annual report
Please find page 137 of the 2013 HTC annual report below. You can navigate through the pages in the report by either clicking on the pages listed below, or by using the keyword search tool below to find specific information within the annual report.-
 1
1 -
2
-
3
-
4
-
5
-
6
-
7
-
8
-
9
-
10
-
11
-
12
-
13
-
14
-
15
-
16
-
17
-
18
-
19
-
20
-
21
-
22
-
23
-
24
-
25
-
26
-
27
-
28
-
29
-
30
-
31
-
32
-
33
-
34
-
35
-
36
-
37
-
38
-
39
-
40
-
41
-
42
-
43
-
44
-
45
-
46
-
47
-
48
-
49
-
50
-
51
-
52
-
53
-
54
-
55
-
56
-
57
-
58
-
59
-
60
-
61
-
62
-
63
-
64
-
65
-
66
-
67
-
68
-
69
-
70
-
71
-
72
-
73
-
74
-
75
-
76
-
77
-
78
-
79
-
80
-
81
-
82
-
83
-
84
-
85
-
86
-
87
-
88
-
89
-
90
-
91
-
92
-
93
-
94
-
95
-
96
-
97
-
98
-
99
-
100
-
101
-
102
-
103
-
104
-
105
-
106
-
107
-
108
-
109
-
110
-
111
-
112
-
113
-
114
-
115
-
116
-
117
-
118
-
119
-
120
-
121
-
122
-
123
-
124
-
125
-
126
-
 127
127 -
 128
128 -
 129
129 -
 130
130 -
 131
131 -
 132
132 -
 133
133 -
 134
134 -
 135
135 -
 136
136 -
 137
137 -
 138
138 -
 139
139 -
 140
140 -
 141
141 -
 142
142 -
 143
143 -
 144
144 -
 145
145 -
 146
146 -
 147
147 -
148
-
149
-
150
-
151
-
152
-
153
-
154
-
155
-
156
-
157
-
158
-
159
-
160
-
161
-
162
 |
 |

FINANCIAL INFORMATION FINANCIAL INFORMATION
270 271
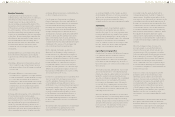
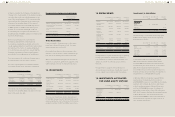
f. Realization of deferred tax assets
Deferred tax assets should be recognized only
to the extent that the entity has sufficient
taxable temporary differences or there is
convincing other evidence that sufficient taxable
profit will be available. The management
applies judgment and accounting estimates to
evaluate the realization of deferred tax assets.
The management takes expected sales growth,
profit rate, duration of exemption, tax credits,
tax planning and etc. into account to make
judgment and estimates. Any change in global
economy, industry environment and regulations
might cause material adjustments to deferred
tax assets.
As of December 31, 2013, December 31, 2012
and January 1, 2012, the carrying amounts
of deferred tax assets were NT$8,665,235
thousand, NT$8,689,842 thousand and
NT$6,319,978 thousand, respectively.
g. Estimates of warranty provision
The Company estimates cost of product
warranties at the time the revenue is recognized.
The estimates of warranty provision are on
the basis of sold products and the amount of
expenditure required for settlement of present
obligation at the end of the reporting period.
The Company might recognize additional
provisions because of the possible complex
intellectual product malfunctions and the
change of local regulations, articles and industry
environment.
As of December 31, 2013, December 31, 2012
and January 1, 2012, the carrying amounts of
warranty provision were NT$7,376,035 thousand,
NT$8,058,509 thousand and NT$13,080,394
thousand, respectively.
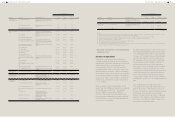
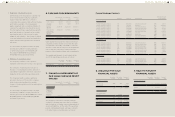
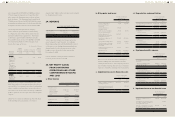
6. CASH AND CASH EQUIVALENTS
December 31,
2013
December 31,
2012
January 1,
2012
Cash on hand $2,479 $15,433 $6,436
Checking
accounts
15,209 12,134 9,709
Demand
deposits
28,639,014 36,224,664 28,197,300
Time deposits
(with original
maturities less
than three
months)
24,642,239 14,713,912 33,813,313
$53,298,941 $50,966,143 $62,026,758
Cash equivalents include time deposits that have
a maturity of three months or less from the date
of acquisition, are readily convertible to a known
amount of cash, and are subject to an insignificant
risk of change in value; these were held for the
purpose of meeting short-term cash commitments.
The market rate intervals of cash in bank at the
end of the reporting period were as follows:
December
31, 2013
December
31, 2012
January 1,
2012
Bank deposits 0.2%~0.85% 0.2%~1.05% 0.15%~1%
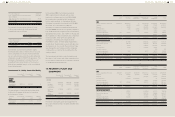
7. FINANCIAL INSTRUMENTS AT
FAIR VALUE THROUGH PROFIT
OR LOSS
December 31,
2013
December 31,
2012
January 1,
2012
Financial assets
held for trading
Derivatives (not
designated
as hedging
instruments)
Exchange
contracts $162,297 $6,950 $256,868
The Company entered into forward exchange
contracts to manage exposures due to exchange
rate fluctuations of foreign currency denominated
assets and liabilities. At the end of the reporting
period, outstanding forward exchange contracts
not under hedge accounting were as follows:
Forward Exchange Contracts
Buy/Sell Currency Maturity Date
Notional Amount
(In Thousands)
December 31, 2013
Foreign exchange contracts
Foreign exchange contracts
Foreign exchange contracts
Foreign exchange contracts
Foreign exchange contracts
Foreign exchange contracts
Foreign exchange contracts
Foreign exchange contracts
Foreign exchange contracts
Foreign exchange contracts
Sell
Sell
Sell
Sell
Sell
Buy
Buy
Buy
Buy
Buy
EUR/USD
JPY/USD
GBP/USD
USD/NTD
CAD/USD
USD/RMB
CAD/USD
RMB/USD
EUR/USD
GBP/USD
2014.01.02-2014.01.29
2014.03.31
2014.01.15-2014.01.22
2014.01.06-2014.02.05
2014.01.13-2014.01.29
2014.01.08-2014.01.22
2014.01.13
2014.01.08
2014.01.15-2014.01.22
2014.01.15-2014.01.22
EUR 61,000
JPY 3,755,090
GBP 12,000
USD 391,700
CAD 5,500
USD 100,600
CAD 4,000
RMB 11,000
EUR 18,000
GBP 2,000
December 31, 2012
Foreign exchange contracts
Foreign exchange contracts
Foreign exchange contracts
Foreign exchange contracts
Foreign exchange contracts
Foreign exchange contracts
Foreign exchange contracts
Foreign exchange contracts
Sell
Sell
Sell
Sell
Buy
Buy
Buy
Buy
EUR/USD
GBP/USD
USD/NTD
USD/RMB
USD/RMB
USD/JPY
USD/CAD
USD/NTD
2013.01.11-2013.03.27
2013.01.09-2013.03.20
2013.01.17-2013.02.20
2013.01.09-2013.01.30
2013.01.09-2013.01.30
2013.01.09-2013.03.08
2013.01.09-2013.02.22
2013.01.07-2013.02.21
EUR 146,000
GBP 20,700
USD 70,000
USD 78,000
USD 106,000
USD 97,437
USD 22,158
USD 270,000
January 1, 2012
Foreign exchange contracts
Foreign exchange contracts
Foreign exchange contracts
Foreign exchange contracts
Buy
Buy
Sell
Sell
USD/CAD
USD/RMB
EUR/USD
GBP/USD
2012.01.11-2012.02.22
2012.01.04-2012.01.31
2012.01.04-2012.03.30
2012.01.11-2012.02.22
USD 28,010
USD 105,000
EUR 339,000
GBP 17,100
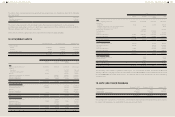
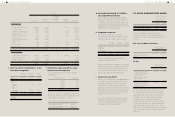
8. AVAILABLE-FOR-SALE
FINANCIAL ASSETS
December
31, 2013
December
31, 2012
January 1,
2012
Domestic investments
Listed stocks
Mutual funds
$239
-
$197
-
$279
736,031
239 197 736,310
Foreign investments
Listed depositary
receipts - 37,902 -
$239 $38,099 $736,310
Current
Non-current
$-
239
$37,902
197
$736,031
279
$239 $38,099 $736,310
9. HELD-TO-MATURITY
FINANCIAL ASSETS
December
31, 2013
December
31, 2012
January 1,
2012
Domestic investments
Bonds $- $101,459 $204,597
Current
Non-current
$-
-
$101,459
-
$-
204,597
$- $101,459 $204,597