HTC 2013 Annual Report Download - page 156
Download and view the complete annual report
Please find page 156 of the 2013 HTC annual report below. You can navigate through the pages in the report by either clicking on the pages listed below, or by using the keyword search tool below to find specific information within the annual report.-
 1
1 -
2
-
3
-
4
-
5
-
6
-
7
-
8
-
9
-
10
-
11
-
12
-
13
-
14
-
15
-
16
-
17
-
18
-
19
-
20
-
21
-
22
-
23
-
24
-
25
-
26
-
27
-
28
-
29
-
30
-
31
-
32
-
33
-
34
-
35
-
36
-
37
-
38
-
39
-
40
-
41
-
42
-
43
-
44
-
45
-
46
-
47
-
48
-
49
-
50
-
51
-
52
-
53
-
54
-
55
-
56
-
57
-
58
-
59
-
60
-
61
-
62
-
63
-
64
-
65
-
66
-
67
-
68
-
69
-
70
-
71
-
72
-
73
-
74
-
75
-
76
-
77
-
78
-
79
-
80
-
81
-
82
-
83
-
84
-
85
-
86
-
87
-
88
-
89
-
90
-
91
-
92
-
93
-
94
-
95
-
96
-
97
-
98
-
99
-
100
-
101
-
102
-
103
-
104
-
105
-
106
-
107
-
108
-
109
-
110
-
111
-
112
-
113
-
114
-
115
-
116
-
117
-
118
-
119
-
120
-
121
-
122
-
123
-
124
-
125
-
126
-
127
-
128
-
129
-
130
-
131
-
132
-
133
-
134
-
135
-
136
-
137
-
138
-
139
-
140
-
141
-
142
-
143
-
144
-
145
-
 146
146 -
 147
147 -
 148
148 -
 149
149 -
 150
150 -
 151
151 -
 152
152 -
 153
153 -
 154
154 -
 155
155 -
 156
156 -
 157
157 -
 158
158 -
 159
159 -
 160
160 -
 161
161 -
 162
162
 |
 |

FINANCIAL INFORMATION FINANCIAL INFORMATION
308 309
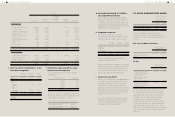
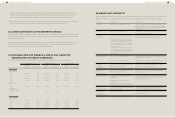
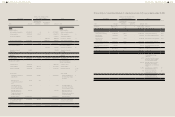
3) Reconciliation of consolidated statement of comprehensive income for the year ended December 31, 2012
ROC GAAP
Effect of the Transition from
ROC GAAP to IFRSs IFRSs
Note
Item Amount
Measurement
or Recognition
Difference
Presentation
Difference Amount Item
Revenues $289,020,175 $- $- $289,020,175 Revenues
Cost of revenues 216,095,098 (5,772) - 216,089,326 Cost of revenues d), f)
Gross profit 72,925,077 5,772 - 72,930,849 Gross profit
Operating expenses
Selling and marketing 32,387,932 (5,369) - 32,382,563 Selling and marketing d), f)
General and
administrative
6,227,469 364 - 6,227,833 General and administrative d), f)
Research and
development
15,489,969 3,170 - 15,493,139 Research and development d), f)
Total operating expenses 54,105,370 (1,835) - 54,103,535 Total operating expenses
Operating profit 18,819,707 7,607 - 18,827,314 Operating profit
Non-operating income and
expenses
630,751 - - 630,751 Non-operating income and
expenses
Profit before income tax 19,450,458 7,607 - 19,458,065 Profit before income tax
Income tax (1,861,272) 25,000 - (1,836,272) Income tax c)
Profit for the period $17,589,186 $32,607 $- 17,621,793 Profit for the period
$(1,089,693) Exchange difference
on translating foreign
operation
6,777 Unrealized valuation gains
and losses from available-
for-sale financial assets
194,052 Effective portion of gains
and losses on hedging
instruments in a cash flow
hedge
(5,382) Actuarial loss on defined
benefit pension plan
d)
915 Income tax relating to
components of other
comprehensive income
d)
(893,331) Other comprehensive
income and loss for the
period, net of income tax
$16,728,462 Total comprehensive income
ROC GAAP
Effect of the Transition from
ROC GAAP to IFRSs IFRSs
Note
Item Amount
Measurement
or Recognition
Difference
Presentation
Difference Amount Item
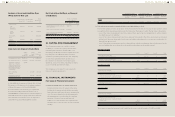
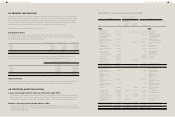
Liabilities and stockholders'
equity
Liabilities and stockholders'
equity
Current liabilities Current liabilities
Note and trade payables $73,618,197 $- $- $73,618,197 Note and trade payables
Other payables 39,173,722 93,451 - 39,267,173 Other payables f)
Income tax payables 2,713,373 - - 2,713,373 Current tax liabilities
- - - 8,881,514 8,881,514 Provisions - current e)
Other current liabilities 10,669,620 - (8,881,514) 1,788,106 Other current liabilities e)
Total current liabilities 126,174,912 93,451 - 126,268,363 Total current liabilities
Non-current liabilities Non-current liabilities
- - - 647,936 647,936 Deferred tax liabilities b)
Guarantee deposits
received
59,999 - - 59,999 Guarantee deposits
received
Total non-current
liabilities
59,999 - 647,936 707,935 Total non-current
liabilities
Total liabilities 126,234,911 93,451 647,936 126,976,298 Total liabilities
Stockholders' equity Equity attributable to
owners of the parent
Common stock 8,520,521 - - 8,520,521 Common stock
Capital surplus 16,619,594 (18,037) - 16,601,557 Capital surplus i)
Retained earnings 70,148,728 (46,697) - 70,102,031 Retained earnings c), d),
f), i),
j)
Other equity Other equity
Cumulative translation
adjustments
(1,057,559) (32,134) - (1,089,693) Exchange differences
on translating foreign
operation
j)
Net losses not
recognized as pension
cost
(347) 347 - - - d)
Unrealized gains or
losses from available-
for-sale financial assets
9,716 - - 9,716 Unrealized gains or
losses from available-
for-sale financial assets
Effective portion of
gains and losses on
hedging instruments in
a cash flow hedge
194,052 - - 194,052 Effective portion of
gains and losses on
hedging instruments in
a cash flow hedge
Treasury shares (14,065,490) - - (14,065,490) Treasury shares
Total equity attributable
to stockholders of the
parent
80,369,215 (96,521) - 80,272,694 Total equity attributable
to owners of the parent
Total $206,604,126 $(3,070) $647,936 $207,248,992 Total
(Concluded)