HTC 2013 Annual Report Download - page 119
Download and view the complete annual report
Please find page 119 of the 2013 HTC annual report below. You can navigate through the pages in the report by either clicking on the pages listed below, or by using the keyword search tool below to find specific information within the annual report.-
 1
1 -
2
-
3
-
4
-
5
-
6
-
7
-
8
-
9
-
10
-
11
-
12
-
13
-
14
-
15
-
16
-
17
-
18
-
19
-
20
-
21
-
22
-
23
-
24
-
25
-
26
-
27
-
28
-
29
-
30
-
31
-
32
-
33
-
34
-
35
-
36
-
37
-
38
-
39
-
40
-
41
-
42
-
43
-
44
-
45
-
46
-
47
-
48
-
49
-
50
-
51
-
52
-
53
-
54
-
55
-
56
-
57
-
58
-
59
-
60
-
61
-
62
-
63
-
64
-
65
-
66
-
67
-
68
-
69
-
70
-
71
-
72
-
73
-
74
-
75
-
76
-
77
-
78
-
79
-
80
-
81
-
82
-
83
-
84
-
85
-
86
-
87
-
88
-
89
-
90
-
91
-
92
-
93
-
94
-
95
-
96
-
97
-
98
-
99
-
100
-
101
-
102
-
103
-
104
-
105
-
106
-
107
-
108
-
 109
109 -
 110
110 -
 111
111 -
 112
112 -
 113
113 -
 114
114 -
 115
115 -
 116
116 -
 117
117 -
 118
118 -
 119
119 -
 120
120 -
 121
121 -
 122
122 -
 123
123 -
 124
124 -
 125
125 -
 126
126 -
 127
127 -
 128
128 -
 129
129 -
130
-
131
-
132
-
133
-
134
-
135
-
136
-
137
-
138
-
139
-
140
-
141
-
142
-
143
-
144
-
145
-
146
-
147
-
148
-
149
-
150
-
151
-
152
-
153
-
154
-
155
-
156
-
157
-
158
-
159
-
160
-
161
-
162
 |
 |

FINANCIAL INFORMATION FINANCIAL INFORMATION
234 235
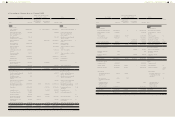
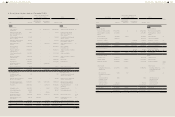
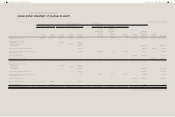
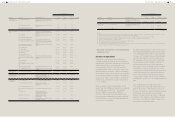
c. Reconciliation of statement of comprehensive income for the year ended December 31, 2012
ROC GAAP
Effect of the Transition from
ROC GAAP to IFRSs IFRSs
Note
Item Amount
Measurement
or Recognition
Difference
Presentation
Difference Amount Item
Revenues $270,701,687 $- $- $270,701,687 Revenues
Cost of revenues 213,712,615 (5,721) - 213,706,894 Cost of revenues 4), 6)
Gross profit 56,989,072 5,721 - 56,994,793 Gross profit
Unrealized intercompany
gains
(2,354,363) - - (2,354,363) Unrealized gains
Realized intercompany
gains
1,151,531 - - 1,151,531 Realized gains
Realized gross profit 55,786,240 5,721 - 55,791,961 Realized gross profit
Operating expenses Operating expenses
Selling and marketing 21,721,715 (5,348) - 21,716,367 Selling and marketing 4), 6)
General and
administrative
5,521,252 386 - 5,521,638 General and
administrative
4), 6)
Research and
development
13,780,378 3,191 - 13,783,569 Research and
development
4), 6)
Total operating expenses 41,023,345 (1,771) - 41,021,574
Operating profit 14,762,895 7,492 - 14,770,387 Operating profit
Non-operating income and
expenses
2,162,208 115 - 2,162,323 Non-operating income and
expenses
4)
Profit before income tax 16,925,103 7,607 - 16,932,710 Profit before income tax
Income tax 144,135 (25,000) - 119,135 Income tax 3)
Profit for the period $16,780,968 $32,607 $- 16,813,575 Profit for the period
(1,089,693) Exchange differences
on translating foreign
operation
6,777 Unrealized gain on
available-for-sale financial
assets
194,052 Cash flow hedge
(5,311) Actuarial gains on defined
benefit plan
4)
(59) Share of other
comprehensive income of
subsidiaries, associates and
joint ventures
903 Income tax relating to
components of other
comprehensive income
4)
(893,331) Other comprehensive
income and loss for the
period, net of income tax
$15,920,244 Total comprehensive income
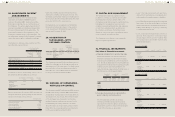
d. Exemptions
Except for optional exemptions and mandatory exceptions to retrospective application provided under the
Regulations, the Company retrospectively applied the Regulations to prepare its opening balance sheet at the date
of transition, January 1, 2012. The major optional exemptions the Company elected are summarized as follows:
1) Investments in subsidiaries, associates and joint ventures
The Company elected to measure the investments in subsidiaries, associates and joint ventures acquired before
the date of transition, at the same carrying amount as recognized under ROC GAAP as of December 31, 2011.
2) Business combinations
The Company elected not to apply IFRS 3
- Business Combination retrospectively to
business combinations that occurred before the
date of transition. Thus, in the opening balance
sheet, the amount of goodwill generated
from past business combinations remains the
same as that shown under ROC GAAP as of
December 31, 2011.
3) Goodwill arising from business combinations
and fair value adjustments
In accordance with IAS 21 - "The Effects of
Changes in Foreign Exchange Rates", any
goodwill and any fair value adjustment to the
carrying amounts of assets and liabilities arising
on the acquisition of a foreign operation should
be treated as assets and liabilities of the foreign
operation. Thus, goodwill and those fair value
adjustments should be expressed in the foreign
operation's functional currency and should
be translated at the closing rate at the end of
the reporting period. The Company elected
not to apply IAS 21 retrospectively to goodwill
and those fair value adjustments arising from
business combinations that occurred before the
date of transition. Thus, goodwill and fair value
adjustments that occurred before the date of
transition are expressed in New Taiwan dollars
using the historical exchange rates.
4) Share-based payment transactions
The Company elected to use the exemption
from the retrospective application of IFRS
2 - "Share-based Payment" to all equity
instruments that were granted and vested
before the date of transition.
5) Employee benefits
The Company elected to recognize all
cumulative actuarial gains and losses on
employee benefits in accumulated earnings as
of the date of transition.
6) Accumulated balances of exchange differences
resulting from translating the financial
statements of a foreign operation.
The Company elected to reset the accumulated
balances of exchange differences resulting
fromtranslating the financial statements of
a foreign operation to zero at the date of
transition, and the reversal has been used to
offset accumulated earnings as of December 31,
2011. Thus, the gain or loss on any subsequent
disposal of foreign operations should exclude
translation differences that arose before the
date of transition.
e. Explanations of significant reconciling items in
the transition to Regulations
Material differences between the accounting
policies under ROC GAAP and the accounting
policies adopted under Regulations were as
follows:
1) Under ROC GAAP, the term "cash" used in
the financial statements includes cash on
hand, demand deposits, check deposits, time
deposits that are cancellable but without any
loss of principal and negotiable certificates of
deposit that are readily salable without any loss
of principal. However, under the Regulations,
cash equivalents are short-term, highly liquid
investments that are both readily convertible
to known amounts of cash and so near their
maturity that they present insignificant risk
of changes in value. An investment normally
qualifies as a cash equivalent only when it has a
short maturity of three months or less from the
date of acquisition. Some certificates of deposit
the Company held had maturity of more than
3 months from the date of investment. Thus,
as of January 1 and December 31, 2012, the
reclassification adjustment resulted in decreases
of NT$25,474,750 thousand and NT$1,960,900
thousand, respectively, in "cash and cash
equivalents" and increases by the same amounts
in "other current financial assets."
2) Under ROC GAAP, a deferred income tax
asset or liability should be classified as
current or noncurrent in accordance with the
classification of the related asset or liability
for financial