HTC 2013 Annual Report Download - page 145
Download and view the complete annual report
Please find page 145 of the 2013 HTC annual report below. You can navigate through the pages in the report by either clicking on the pages listed below, or by using the keyword search tool below to find specific information within the annual report.-
 1
1 -
2
-
3
-
4
-
5
-
6
-
7
-
8
-
9
-
10
-
11
-
12
-
13
-
14
-
15
-
16
-
17
-
18
-
19
-
20
-
21
-
22
-
23
-
24
-
25
-
26
-
27
-
28
-
29
-
30
-
31
-
32
-
33
-
34
-
35
-
36
-
37
-
38
-
39
-
40
-
41
-
42
-
43
-
44
-
45
-
46
-
47
-
48
-
49
-
50
-
51
-
52
-
53
-
54
-
55
-
56
-
57
-
58
-
59
-
60
-
61
-
62
-
63
-
64
-
65
-
66
-
67
-
68
-
69
-
70
-
71
-
72
-
73
-
74
-
75
-
76
-
77
-
78
-
79
-
80
-
81
-
82
-
83
-
84
-
85
-
86
-
87
-
88
-
89
-
90
-
91
-
92
-
93
-
94
-
95
-
96
-
97
-
98
-
99
-
100
-
101
-
102
-
103
-
104
-
105
-
106
-
107
-
108
-
109
-
110
-
111
-
112
-
113
-
114
-
115
-
116
-
117
-
118
-
119
-
120
-
121
-
122
-
123
-
124
-
125
-
126
-
127
-
128
-
129
-
130
-
131
-
132
-
133
-
134
-
 135
135 -
 136
136 -
 137
137 -
 138
138 -
 139
139 -
 140
140 -
 141
141 -
 142
142 -
 143
143 -
 144
144 -
 145
145 -
 146
146 -
 147
147 -
 148
148 -
 149
149 -
 150
150 -
 151
151 -
 152
152 -
 153
153 -
 154
154 -
 155
155 -
156
-
157
-
158
-
159
-
160
-
161
-
162
 |
 |

FINANCIAL INFORMATION FINANCIAL INFORMATION
286 287
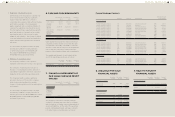
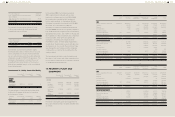
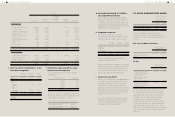
price ranged from NT$140 to NT$290 per share.
If the Company's share price is lower than this
price range, the Company may continue to buy
back its shares. The Company had bought back
7,789 thousand shares for NT$1,033,846 thousand
during the repurchase period, which retired by the
Company's board of directors in November 2013.
The Company had repurchased company
shares from the open market for transferring
to employees and some of them had not been
transferred before the expiry time. The Board
of Directors approved the retirement of 1,912
thousand treasury stocks on September 27, 2013.
The related information on the treasury stock
transactions was as follows:
(In Thousands of Shares)
Reason to
Reacquire
Number
of Shares,
Beginning
of Year
Addition
During the
Year
Reduction
During the
Year
Number
of Shares,
End of
Year
For 2013
To transfer
shares to the
Company's
employees
20,825 - 1,912 18,913
To maintain
the
Company's
credibility and
stockholders'
interest
- 7,789 7,789 -
20,825 7,789 9,701 18,913
For 2012
To transfer
shares to the
Company's
employees
14,011 6,814 - 20,825
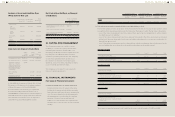
Based on the Securities and Exchange Act of the
ROC, the number of reacquired shares should not
exceed 10% of a company's issued and outstanding
shares, and the total purchase amount should not
exceed the sum of the retained earnings, additional
paid-in capital in excess of par and realized capital
surplus.
Under the Securities and Exchange Act, HTC shall
neither pledge treasury shares nor exercise
shareholders' rights on these shares, such as rights
to dividends and to vote.
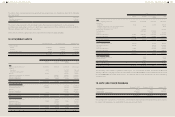
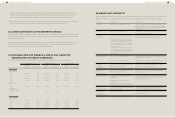
24. REVENUE
For the Year Ended December 31
2013 2012
Sale of goods $200,208,038 $282,914,686
Other operating
income
3,194,610 6,105,489
$203,402,648 $289,020,175
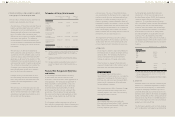
Some sales denominated in foreign currencies
were hedged for cash flow risk. Accordingly,
the Company transferred NT$262,648 thousand
of the gain on the hedging instrument that was
determined to be the effective portion of the
hedge to sales of goods for the year ended
December 31, 2013.
For the analysis of main products and other
revenue, please refer to Note 39.
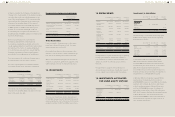
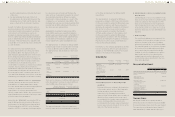
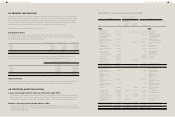
25. NET PROFIT (LOSS)
FROM CONTINUING
OPERATIONS AND OTHER
COMPREHENSIVE INCOME
AND LOSS
a. Other income
For the Year Ended December 31
2013 2012
Interest income
Cash in bank $342,422 $533,898
Held-to-maturity
financial assets
794 1,710
Loan 211,139 82,027
554,355 617,635
Dividend income 16,282 22,441
Others 594,311 528,456
$1,164,948 $1,168,532
b. Other gains and losses
For the Year Ended
December 31
2013 2012
Losses on disposal of
property, plant and
equipment
$(58) $(6,395)
Gain on disposal of
intangible assets
108,265 -
Gains on sale of available-
for-sale financial assets
29,735 49,084
Gain on disposal of
investments accounted for
using equity method
2,637,673 -
Gain (loss) on disposal of
subsidiaries
175,435 (214,268)
Net foreign exchange gains 109,960 666,883
Valuation gains on financial
liabilities classified as held
for trading
162,297 6,950
Hedge ineffective portion on
cash flow hedges
151,305 10,467
Impairment loss (864,352) (1,313,353)
Other losses (88,994) (122,912)
$2,421,266 $(923,544)
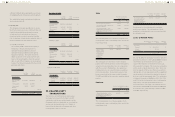
Gain or loss on financial assets and liabilities
held for trading was derived from forward
exchange transactions. The Company entered
into forward exchange transactions to manage
exposures related to exchange rate fluctuations.
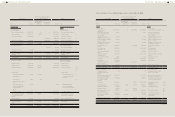
c. Impairment losses on financial assets
For the Year Ended
December 31
2013 2012
Trade receivables (included in
operating expense)
$1,010,405 $531,364
Financial assets measured at
cost (included in other gains
and losses)
- 1,199,045
$1,010,405 $1,730,409
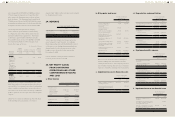
d. Depreciation and amortization
For the Year Ended
December 31
2013 2012
Property, plant and equipment $2,916,699 $2,463,017
Intangible assets 1,968,492 2,047,681
$4,885,191 $4,510,698
Classification of depreciation -
by function
Cost of revenues $1,538,825 $1,322,730
Operating expenses 1,377,874 1,140,287
$2,916,699 $2,463,017
Classification of amortization
- by function
Cost of revenues $6,841 $6,833
Operating expenses 1,961,651 2,040,848
$1,968,492 $2,047,681
e. Employee benefits expense
For the Year Ended
December 31
2013 2012
Post-employment benefits
(Note 22)
Defined contribution plans $786,658 $665,765
Defined benefit plans 1,122 2,366
787,780 668,131
Share-based payments
Equity-settled share-based
payments
26,742 -
Other employee benefits 17,517,784 21,055,551
Total employee benefits expense $18,332,306 $21,723,682
Classification - by function
Cost of revenues $6,539,452 $6,241,376
Operating expenses 11,792,854 15,482,306
$18,332,306 $21,723,682
f. Impairment losses on non-financial assets
For the Year Ended
December 31
2013 2012
Inventories (included in cost of
revenues)
$417,166 $2,154,419
Investments accounted for by
the equity method (included in
other gains and losses)
- 56,687
O t h e r i n t a n g i b l e a s s e t s
(including goodwill) (included
in other gains and losses)
864,352 57,621
$1,281,518 $2,268,727