HTC 2013 Annual Report Download - page 104
Download and view the complete annual report
Please find page 104 of the 2013 HTC annual report below. You can navigate through the pages in the report by either clicking on the pages listed below, or by using the keyword search tool below to find specific information within the annual report.-
 1
1 -
2
-
3
-
4
-
5
-
6
-
7
-
8
-
9
-
10
-
11
-
12
-
13
-
14
-
15
-
16
-
17
-
18
-
19
-
20
-
21
-
22
-
23
-
24
-
25
-
26
-
27
-
28
-
29
-
30
-
31
-
32
-
33
-
34
-
35
-
36
-
37
-
38
-
39
-
40
-
41
-
42
-
43
-
44
-
45
-
46
-
47
-
48
-
49
-
50
-
51
-
52
-
53
-
54
-
55
-
56
-
57
-
58
-
59
-
60
-
61
-
62
-
63
-
64
-
65
-
66
-
67
-
68
-
69
-
70
-
71
-
72
-
73
-
74
-
75
-
76
-
77
-
78
-
79
-
80
-
81
-
82
-
83
-
84
-
85
-
86
-
87
-
88
-
89
-
90
-
91
-
92
-
93
-
 94
94 -
 95
95 -
 96
96 -
 97
97 -
 98
98 -
 99
99 -
 100
100 -
 101
101 -
 102
102 -
 103
103 -
 104
104 -
 105
105 -
 106
106 -
 107
107 -
 108
108 -
 109
109 -
 110
110 -
 111
111 -
 112
112 -
 113
113 -
 114
114 -
115
-
116
-
117
-
118
-
119
-
120
-
121
-
122
-
123
-
124
-
125
-
126
-
127
-
128
-
129
-
130
-
131
-
132
-
133
-
134
-
135
-
136
-
137
-
138
-
139
-
140
-
141
-
142
-
143
-
144
-
145
-
146
-
147
-
148
-
149
-
150
-
151
-
152
-
153
-
154
-
155
-
156
-
157
-
158
-
159
-
160
-
161
-
162
 |
 |

FINANCIAL INFORMATION FINANCIAL INFORMATION
204 205
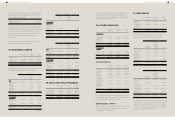
The market interest rates of the time deposits with
original maturity more than three months were as follows:
December 31,
2013
December 31,
2012
January 1,
2012
Time deposits
with original
maturities
more than
three months
- 0.39%~1.10% 0.39%~1.345%
For details of pledged other current financial
assets, please refer to Note 34.
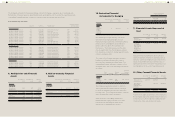
13. NOTES RECEIVABLE, TRADE
RECEIVABLES AND OTHER
RECEIVABLES
December 31,
2013
December 31,
2012
January 1,
2012
Note and trade
receivables
Note receivables $- $- $755,450
Trade receivables 17,017,529 21,816,781 32,852,266
Trade receivables
- related parties
13,203,577 19,468,130 32,977,269
Less: Allowances
for doubtful debts
(3,050,907) (2,073,018) (1,567,940)
$27,170,199 $39,211,893 $65,017,045
Other receivables
Loan receivables -
fluctuation rate
$- $6,554,025 $-
VAT refund
receivables
102,407 210,066 558,279
Interest
receivables
7,344 52,806 19,927
Others 1,746,645 1,117,226 1,115,915
$1,856,396 $7,934,123 $1,694,121
Trade Receivables
The credit period on sales of goods is 30-75 days.
No interest is charged on trade receivables before
the due date. Thereafter, interest is charged at
1-18% per annum on the outstanding balance,
which is considered to be non-controversial,
to some of customers. In determining the
recoverability of a trade receivable, the Company
considered any change in the credit quality of the
trade receivable since the date credit was initially
granted to the
Other Receivables
Loan receivables - fluctuation rate is the short-
term loan to Beats Electronics, LLC. For more
details, please refer to Note 33.
Others were primarily prepayments on behalf of
vendors or customers, grants from suppliers and
withholding income tax of employees' bonuses.
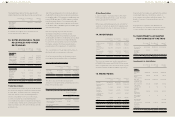
14. INVENTORIES
December 31,
2013
December 31,
2012
January 1,
2012
Finished goods $1,246,743 $764,667 $675,712
Work-in-
process
528,331 1,940,584 3,766,461
Semi-finished
goods
6,525,186 3,954,056 4,083,050
Raw materials 9,885,652 13,652,134 16,788,114
Inventory in
transit
277,744 210,526 75,983
$18,463,656 $20,521,967 $25,389,320
The losses on inventories decline amounting to
NT$439,139 thousand and NT$1,211,554 thousand
were recognized as cost of revenues for the years
ended December 31, 2013 and 2012, respectively.
15. PREPAYMENTS
December 31,
2013
December 31,
2012
January 1,
2012
Royalty $10,425,441 $8,238,869 $10,736,178
Prepayments to
suppliers
2,484,795 2,974,176 3,206,046
Molding
expenses
302,385 96,859 188,242
Prepaid
equipment
146,783 208,750 103,745
Software and
hardware
maintenance
130,087 673,703 263,211
Service 16,241 61,171 548,480
Others 105,299 67,134 72,862
$13,611,031 $12,320,662 $15,118,764
Current
Non-current
$3,596,806
10,014,225
$4,154,949
8,165,713
$6,473,372
8,645,392
$13,611,031 $12,320,662 $15,118,764
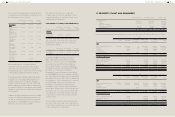
end of the reporting period. For customers with low
credit risk, the Company has recognized an allowance
for doubtful debts of 1-5% against receivables past due
beyond 31-90 days and of 5-100% against receivables
past due beyond 91 days. For customers with high
credit risk, the Company has recognized an allowance
for doubtful debts of 10-100% against receivables past
due more than 31 days.
Before accepting any new customer, the
Company's Department of Financial and
Accounting evaluates the potential customer's
credit quality and defines credit limits and scorings
by customer. The factor of overdue attributed
to customers are reviewed once a week and the
Company evaluates the financial performance
periodically for the adjustment of credit limits.
The concentration of credit risk is limited due to
the fact that the customer base is diverse.
As of the reporting date, the Company had no
receivables that are past due but not impaired.
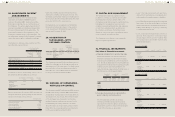
Age of impaired trade receivables
December 31,
2013
December 31,
2012
January 1,
2012
1-90 days
91-180 days
Over 181 days
$10,471,140
406,751
-
$5,775,662
164,250
-
$11,039,103
408,378
60,724
$10,877,891 $5,939,912 $11,508,205
The above was shown after deducting the
allowance for doubtful debts and analyzed on the
basis of the past due date.
Movement in the allowances for doubtful debts
For the Year Ended
December 31
2013 2012
Balance, beginning of the year $2,073,018 $1,567,940
Impairment losses recognized
on receivables
991,821 505,078
Amounts written off as
uncollectible
(13,932) -
Balance, end of the year $3,050,907 $2,073,018
Prepayments for royalty were primarily for getting
royalty right and were classified as current or
non-current in accordance with their nature. For
details of content of contracts, please refer to
Note 38.
Prepayments to suppliers were primarily for
discount purposes and were classified as current
or non-current in accordance with their nature.
16. INVESTMENTS ACCOUNTED
FOR USING EQUITY METHOD
December 31,
2013
December 31,
2012
January 1,
2012
Investment in
subsidiaries
$41,902,845 $39,539,940 $35,904,924
Investment
in jointly
controlled
entity
227,504 241,309 -
$42,130,349 $39,781,249 $35,904,924
Investments in Subsidiaries
December 31,
2013
December 31,
2012
January 1,
2012
Unlisted
companies
H.T.C. (B.V.I.)
Corp.
$2,985,327 $2,853,189 $2,885,514
Communication
Global
Certification Inc.
566,965 563,998 463,312
High Tech
Computer Asia
Pacific Pte. Ltd.
29,477,842 26,446,634 22,094,532
HTC Investment
Corporation
303,556 303,889 301,332
PT. High Tech
Computer
Indonesia
62 62 62
HTC I
Investment
Corporation
298,654 300,106 295,902
HTC Holding
Cooperatief
U.A.
13 13 13
Huada Digital
Corporation
- - 250,689
HTC Investment
One (BVI)
Corporation
8,270,426 9,072,019 9,613,568
FunStream
Corporation
- 30 -
$41,902,845 $39,539,940 $35,904,924