HP 2014 Annual Report Download - page 95
Download and view the complete annual report
Please find page 95 of the 2014 HP annual report below. You can navigate through the pages in the report by either clicking on the pages listed below, or by using the keyword search tool below to find specific information within the annual report.-
 1
1 -
2
-
3
-
4
-
5
-
6
-
7
-
8
-
9
-
10
-
11
-
12
-
13
-
14
-
15
-
16
-
17
-
18
-
19
-
20
-
21
-
22
-
23
-
24
-
25
-
26
-
27
-
28
-
29
-
30
-
31
-
32
-
33
-
34
-
35
-
36
-
37
-
38
-
39
-
40
-
41
-
42
-
43
-
44
-
45
-
46
-
47
-
48
-
49
-
50
-
51
-
52
-
53
-
54
-
55
-
56
-
57
-
58
-
59
-
60
-
61
-
62
-
63
-
64
-
65
-
66
-
67
-
68
-
69
-
70
-
71
-
72
-
73
-
74
-
75
-
76
-
77
-
78
-
79
-
80
-
81
-
82
-
83
-
84
-
 85
85 -
 86
86 -
 87
87 -
 88
88 -
 89
89 -
 90
90 -
 91
91 -
 92
92 -
 93
93 -
 94
94 -
 95
95 -
 96
96 -
 97
97 -
 98
98 -
 99
99 -
 100
100 -
 101
101 -
 102
102 -
 103
103 -
 104
104 -
 105
105 -
106
-
107
-
108
-
109
-
110
-
111
-
112
-
113
-
114
-
115
-
116
-
117
-
118
-
119
-
120
-
121
-
122
-
123
-
124
-
125
-
126
-
127
-
128
-
129
-
130
-
131
-
132
-
133
-
134
-
135
-
136
-
137
-
138
-
139
-
140
-
141
-
142
-
143
-
144
-
145
-
146
-
147
-
148
-
149
-
150
-
151
-
152
-
153
-
154
-
155
-
156
-
157
-
158
-
159
-
160
-
161
-
162
-
163
-
164
-
165
-
166
-
167
-
168
-
169
-
170
-
171
-
172
-
173
-
174
-
175
-
176
-
177
-
178
-
179
-
180
-
181
-
182
-
183
-
184
-
185
-
186
-
187
-
188
-
189
-
190
-
191
-
192
-
193
-
194
-
195
-
196
 |
 |

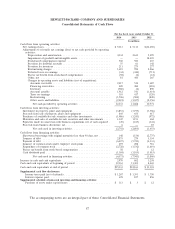
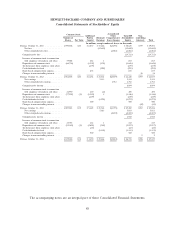
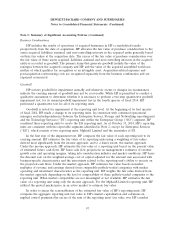
HEWLETT-PACKARD COMPANY AND SUBSIDIARIES
Consolidated Statements of Cash Flows
For the fiscal years ended October 31
2014 2013 2012
In millions
Cash flows from operating activities:
Net earnings (loss) ........................................ $5,013 $ 5,113 $(12,650)
Adjustments to reconcile net earnings (loss) to net cash provided by operating
activities:
Depreciation and amortization ............................. 4,334 4,611 5,095
Impairment of goodwill and intangible assets .................... — — 18,035
Stock-based compensation expense .......................... 560 500 635
Provision for doubtful accounts ............................. 55 61 142
Provision for inventory .................................. 211 275 277
Restructuring charges ................................... 1,619 990 2,266
Deferred taxes on earnings ............................... (34) (410) (711)
Excess tax benefit from stock-based compensation ................ (58) (2) (12)
Other, net .......................................... 81 443 265
Changes in operating assets and liabilities (net of acquisitions):
Accounts receivable ................................... 2,017 530 1,687
Financing receivables .................................. 420 484 (418)
Inventory ......................................... (580) (4) 890
Accounts payable .................................... 1,912 541 (1,414)
Taxes on earnings .................................... 310 417 (320)
Restructuring ....................................... (1,506) (904) (840)
Other assets and liabilities .............................. (2,021) (1,037) (2,356)
Net cash provided by operating activities ................... 12,333 11,608 10,571
Cash flows from investing activities:
Investment in property, plant and equipment ....................... (3,853) (3,199) (3,706)
Proceeds from sale of property, plant and equipment ................. 843 653 617
Purchases of available-for-sale securities and other investments ........... (1,086) (1,243) (972)
Maturities and sales of available-for-sale securities and other investments .... 1,347 1,153 662
Payments made in connection with business acquisitions, net of cash acquired . (49) (167) (141)
Proceeds from business divestiture, net ........................... 6 — 87
Net cash used in investing activities ....................... (2,792) (2,803) (3,453)
Cash flows from financing activities:
Short-term borrowings with original maturities less than 90 days, net ....... 148 (154) (2,775)
Issuance of debt ......................................... 2,875 279 5,154
Payment of debt ......................................... (6,037) (5,721) (4,333)
Issuance of common stock under employee stock plans ................ 297 288 716
Repurchase of common stock ................................. (2,728) (1,532) (1,619)
Excess tax benefit from stock-based compensation ................... 58 2 12
Cash dividends paid ....................................... (1,184) (1,105) (1,015)
Net cash used in financing activities ....................... (6,571) (7,943) (3,860)
Increase in cash and cash equivalents ............................. 2,970 862 3,258
Cash and cash equivalents at beginning of period ..................... 12,163 11,301 8,043
Cash and cash equivalents at end of period ......................... $
15,133 $12,163 $ 11,301
Supplemental cash flow disclosures:
Income taxes paid (net of refunds) ............................ $1,267 $ 1,391 $ 1,750
Interest expense paid ..................................... 678 837 856
Supplemental schedule of non-cash investing and financing activities:
Purchase of assets under capital leases ......................... $ 113 $ 3 $ 12
The accompanying notes are an integral part of these Consolidated Financial Statements.
87